
LD 17 live results
Updated 7:19 a.m. ET, Wed., Nov. 4, 2026
Unofficial results as posted by the Arizona Secretary of State. Numbers change as counties count more ballots. Margin = Republican minus Democratic votes.
State Senate, LD 17
🔴 Christopher King (Rep.): 48,359 (45.4%)
🔵 Edgar Soto (Dem.): 58,006 (54.5%)
🟡 Write-in candidates (Write-in): 106 (0.1%)
Votes posted: 106,471
Reporting units posted: 2 of 2
Margin: Edgar Soto (Dem.) has 9,647 more votes than Christopher King (Rep.) (9.1 pts), of 106,471 votes counted
State House, LD 17
🔴 John Winchester (Rep.): 46,384 (23.3%)
🔴 Rachel "Jones" Keshel (Rep.): 44,308 (22.3%)
🔵 Kevin Volk (Dem.): 54,249 (27.3%)
🔵 Hollace "Holly" Lyon (Dem.): 54,002 (27.1%)
🟡 Write-in candidates (Write-in): 108 (0.1%)
Votes posted: 199,051
Reporting units posted: 2 of 2
Voters choose 2 House members. Percent = share of all House votes cast in the district.
Source: Arizona Secretary of State. Unofficial results.
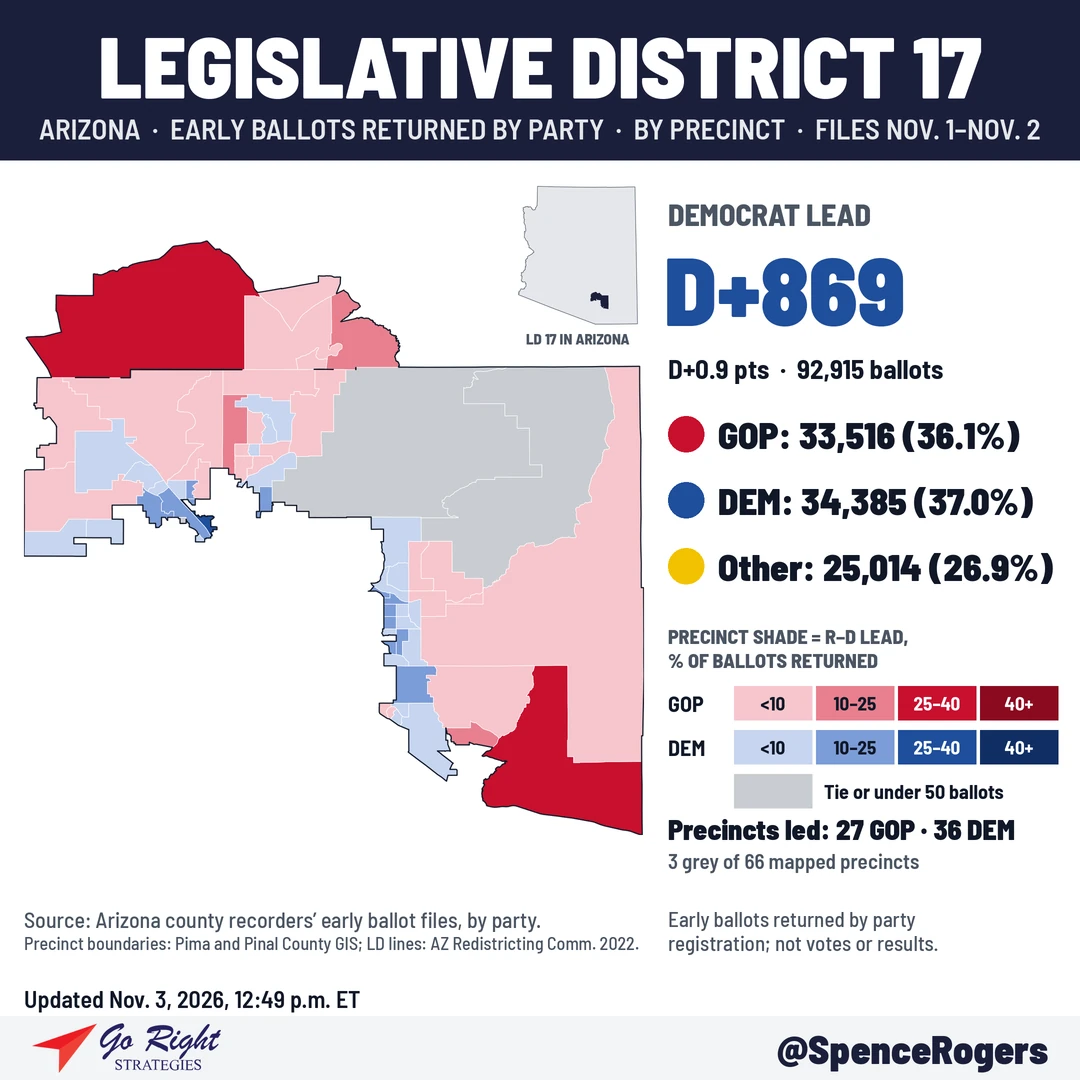
Updated Nov. 3, 2026, 12:49 p.m. ET
🔴 Republicans: 33,516 (36.1%)
🔵 Democrats: 34,385 (37.0%)
🟡 Other: 25,014 (26.9%)
Total returned: 92,915
Margin: D+869
Percentages are rounded and may not add to 100%.
Election Day analysis
Updated Nov. 3, 2026, 2:06 p.m. ET
No Election Day turnout by party is posted yet. Arizona counties do not post in-person Election Day turnout by party during the day. Polls close at 7 p.m. Arizona time (9 p.m. ET). Voters can still drop off early ballots at any voting location in their county until 7 p.m. Arizona time.
Election Day turnout so far (county counts)
Pima County: 24,284 Election Day check-ins as of 1:48 p.m. ET (11:48 a.m. Arizona time). Countywide, not LD only.
Pinal County: more than 10,000 Election Day check-ins, posted 12:41 p.m. ET. Countywide, not LD only.
Source: Arizona county recorders. Pima figure from the Pima County official turnout page. Pinal figure posted by the Pinal County Recorder (Pinal VOTES). These are turnout counts, not votes, with no party breakdown. Counts are early in the day and will rise.
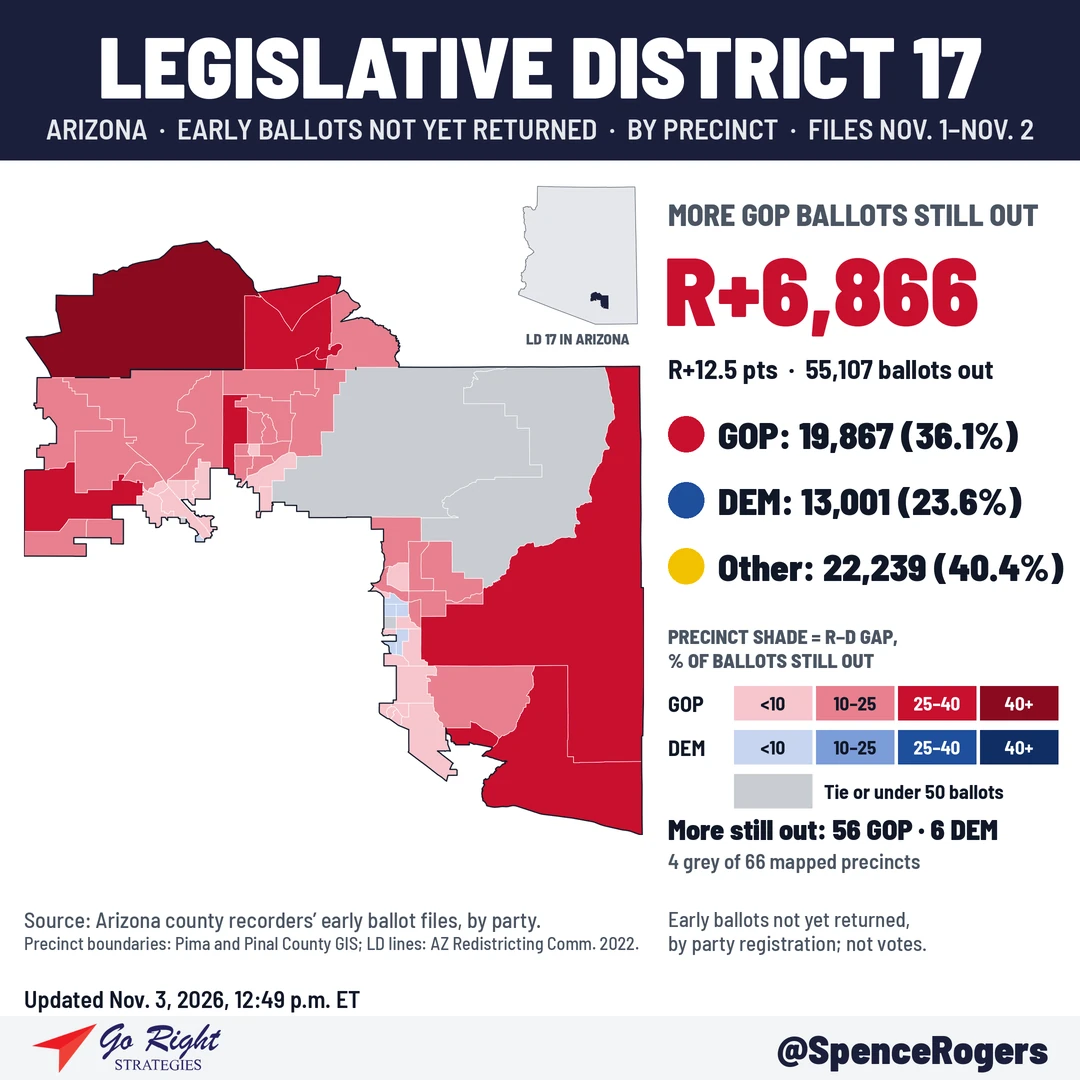
Precinct boundaries: Pima and Pinal County GIS.
Early ballots sent but not yet returned in LD 17
🔴 Republicans: 19,867 (36.1%)
🔵 Democrats: 13,001 (23.6%)
🟡 Other: 22,239 (40.4%)
Total not yet returned: 55,107
Margin: R+6,866
Returned so far: 62.8% of Republican early ballots, 72.6% of Democratic early ballots, 52.9% of Other early ballots.
Not yet returned = early ballots sent minus early ballots returned, by party registration, from the same county files. Some of these voters will drop off their ballot today, some will vote in person, and some will not vote. These are not votes.
LD 17 precincts (66)
Pima County (61)
| Precinct | 🔴 GOP | 🔵 DEM | 🟡 Other | Total | Lead | % of early ballots returned |
|---|---|---|---|---|---|---|
| Precinct 184 | 1,522 | 1,151 | 1,107 | 3,780 | R+371 | 67.7% |
| Precinct 127 | 1,647 | 1,310 | 1,185 | 4,142 | R+337 | 72.0% |
| Precinct 198 | 535 | 310 | 305 | 1,150 | R+225 | 59.5% |
| Precinct 172 | 1,229 | 1,075 | 923 | 3,227 | R+154 | 68.8% |
| Precinct 200 | 518 | 393 | 333 | 1,244 | R+125 | 63.1% |
| Precinct 194 | 707 | 600 | 492 | 1,799 | R+107 | 68.0% |
| Precinct 188 | 542 | 438 | 297 | 1,277 | R+104 | 62.4% |
| Precinct 243 | 445 | 350 | 235 | 1,030 | R+95 | 63.6% |
| Precinct 179 | 820 | 739 | 536 | 2,095 | R+81 | 68.8% |
| Precinct 199 | 600 | 525 | 377 | 1,502 | R+75 | 68.6% |
| Precinct 221 | 148 | 74 | 60 | 282 | R+74 | 56.3% |
| Precinct 176 | 294 | 225 | 194 | 713 | R+69 | 53.1% |
| Precinct 222 | 291 | 225 | 163 | 679 | R+66 | 45.9% |
| Precinct 195 | 815 | 759 | 616 | 2,190 | R+56 | 64.9% |
| Precinct 24 | 373 | 329 | 250 | 952 | R+44 | 54.6% |
| Precinct 175 | 542 | 499 | 345 | 1,386 | R+43 | 46.6% |
| Precinct 173 | 600 | 561 | 404 | 1,565 | R+39 | 67.2% |
| Precinct 216 | 627 | 588 | 444 | 1,659 | R+39 | 72.2% |
| Precinct 46 | 225 | 199 | 133 | 557 | R+26 | 67.0% |
| Precinct 79 | 536 | 516 | 350 | 1,402 | R+20 | 56.7% |
| Precinct 95 | 220 | 209 | 166 | 595 | R+11 | 55.5% |
| Precinct 77 | 535 | 525 | 376 | 1,436 | R+10 | 68.6% |
| Precinct 240 | 22 | 15 | 12 | 49 | R+7 | 62.0% |
| Precinct 65 | 5 | 5 | 4 | 14 | Tied | 53.8% |
| Precinct 39 | 664 | 667 | 505 | 1,836 | D+3 | 63.1% |
| Precinct 273 | 6 | 12 | 19 | 37 | D+6 | 43.0% |
| Precinct 169 | 783 | 794 | 600 | 2,177 | D+11 | 72.5% |
| Precinct 274 | 51 | 65 | 31 | 147 | D+14 | 65.9% |
| Precinct 183 | 267 | 287 | 164 | 718 | D+20 | 58.3% |
| Precinct 126 | 324 | 345 | 247 | 916 | D+21 | 67.8% |
| Precinct 213 | 60 | 87 | 54 | 201 | D+27 | 57.3% |
| Precinct 90 | 216 | 251 | 180 | 647 | D+35 | 50.2% |
| Precinct 212 | 251 | 291 | 184 | 726 | D+40 | 60.2% |
| Precinct 215 | 211 | 251 | 150 | 612 | D+40 | 53.8% |
| Precinct 223 | 241 | 282 | 209 | 732 | D+41 | 53.5% |
| Precinct 257 | 182 | 230 | 126 | 538 | D+48 | 47.0% |
| Precinct 49 | 230 | 280 | 206 | 716 | D+50 | 50.7% |
| Precinct 181 | 657 | 720 | 468 | 1,845 | D+63 | 64.9% |
| Precinct 242 | 316 | 387 | 227 | 930 | D+71 | 54.6% |
| Precinct 150 | 50 | 122 | 87 | 259 | D+72 | 45.6% |
| Precinct 121 | 177 | 251 | 132 | 560 | D+74 | 74.1% |
| Precinct 178 | 451 | 547 | 340 | 1,338 | D+96 | 63.4% |
| Precinct 132 | 175 | 273 | 129 | 577 | D+98 | 52.2% |
| Precinct 224 | 802 | 903 | 726 | 2,431 | D+101 | 49.3% |
| Precinct 131 | 441 | 548 | 331 | 1,320 | D+107 | 68.8% |
| Precinct 6 | 801 | 911 | 698 | 2,410 | D+110 | 47.6% |
| Precinct 197 | 404 | 524 | 313 | 1,241 | D+120 | 56.8% |
| Precinct 130 | 261 | 382 | 195 | 838 | D+121 | 55.3% |
| Precinct 115 | 943 | 1,072 | 791 | 2,806 | D+129 | 62.0% |
| Precinct 40 | 374 | 507 | 273 | 1,154 | D+133 | 50.5% |
| Precinct 180 | 544 | 679 | 406 | 1,629 | D+135 | 62.5% |
| Precinct 220 | 609 | 748 | 477 | 1,834 | D+139 | 70.6% |
| Precinct 145 | 1,079 | 1,230 | 1,010 | 3,319 | D+151 | 78.6% |
| Precinct 12 | 950 | 1,104 | 727 | 2,781 | D+154 | 67.7% |
| Precinct 128 | 344 | 514 | 253 | 1,111 | D+170 | 63.1% |
| Precinct 192 | 472 | 646 | 320 | 1,438 | D+174 | 58.2% |
| Precinct 14 | 510 | 707 | 500 | 1,717 | D+197 | 54.1% |
| Precinct 13 | 382 | 580 | 390 | 1,352 | D+198 | 59.0% |
| Precinct 104 | 677 | 933 | 587 | 2,197 | D+256 | 61.4% |
| Precinct 182 | 469 | 742 | 401 | 1,612 | D+273 | 54.0% |
| Precinct 218 | 816 | 1,175 | 803 | 2,794 | D+359 | 58.0% |
| Pima County total | 29,988 | 31,667 | 22,566 | 84,221 | D+1,679 |
Pinal County (5)
| Precinct | 🔴 GOP | 🔵 DEM | 🟡 Other | Total | Lead | % of early ballots returned |
|---|---|---|---|---|---|---|
| Saddlebrooke East | 869 | 637 | 608 | 2,114 | R+232 | 82.8% |
| Saddlebrooke Ranch | 838 | 652 | 555 | 2,045 | R+186 | 83.7% |
| Saddlebrooke West | 755 | 593 | 523 | 1,871 | R+162 | 81.8% |
| Eagle Crest | 871 | 741 | 682 | 2,294 | R+130 | 75.0% |
| Red Rock | 195 | 95 | 80 | 370 | R+100 | 49.4% |
| Pinal County total | 3,528 | 2,718 | 2,448 | 8,694 | R+810 |
These are ballots returned, not votes.
Latest county file dates: Pima County 11/1. All other counties 11/2.
Precincts in LD 17: Pima County and Pinal County GIS precinct layers overlaid on the Arizona Independent Redistricting Commission's 2022 legislative district map. Every precinct lies wholly in one district, and the result matches the district grouping in the county early ballot files.
Data: compiled from Arizona county recorders' early ballot return files, by party registration. Poll hours and drop-off rules: Arizona Secretary of State. This is not an official state or county release.