
Updated Nov. 3, 2026, 11:53 a.m. ET
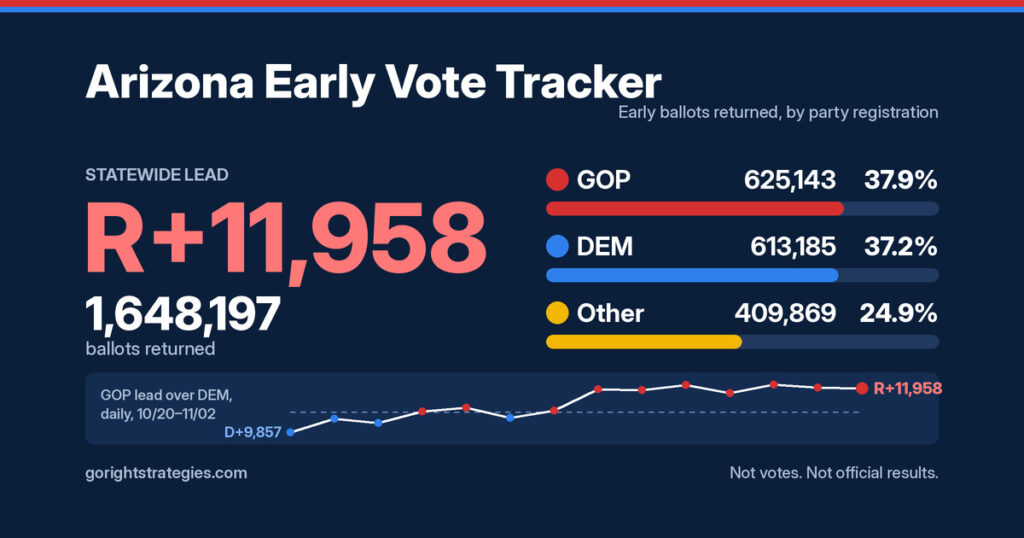
This Arizona early vote tracker shows how many early ballots have come back statewide and in every county, broken out by the voter’s party registration. Arizona votes early, and most of the 2026 general election will be decided by ballots sitting on kitchen counters and in drop boxes right now, not by Election Day lines. It’s updated daily at this same link, so bookmark it.
Arizona early vote: statewide ballots returned
🔴 Republicans: 628,397 (38.0%)
🔵 Democrats: 615,085 (37.2%)
🟡 Other: 412,095 (24.9%)
Total returned: 1,655,577
Margin: R+13,312
My take: Republican-registered voters have returned 13,312 more early ballots than Democratic-registered voters, out of more than 1.6 million. That gap grew by 1,354 since the Nov. 2 update, and every county that posted new numbers moved toward Republicans, led by Pinal’s 6,159 new ballots. A gap under one point in returned ballots is not a result, and returned ballots are not votes. Republicans who are sitting on a ballot are the difference: it’s too late to mail one, so drop it off at any voting location or drop box in your county by 7 p.m. Arizona time today.
Percentages are rounded and may not add to 100%.
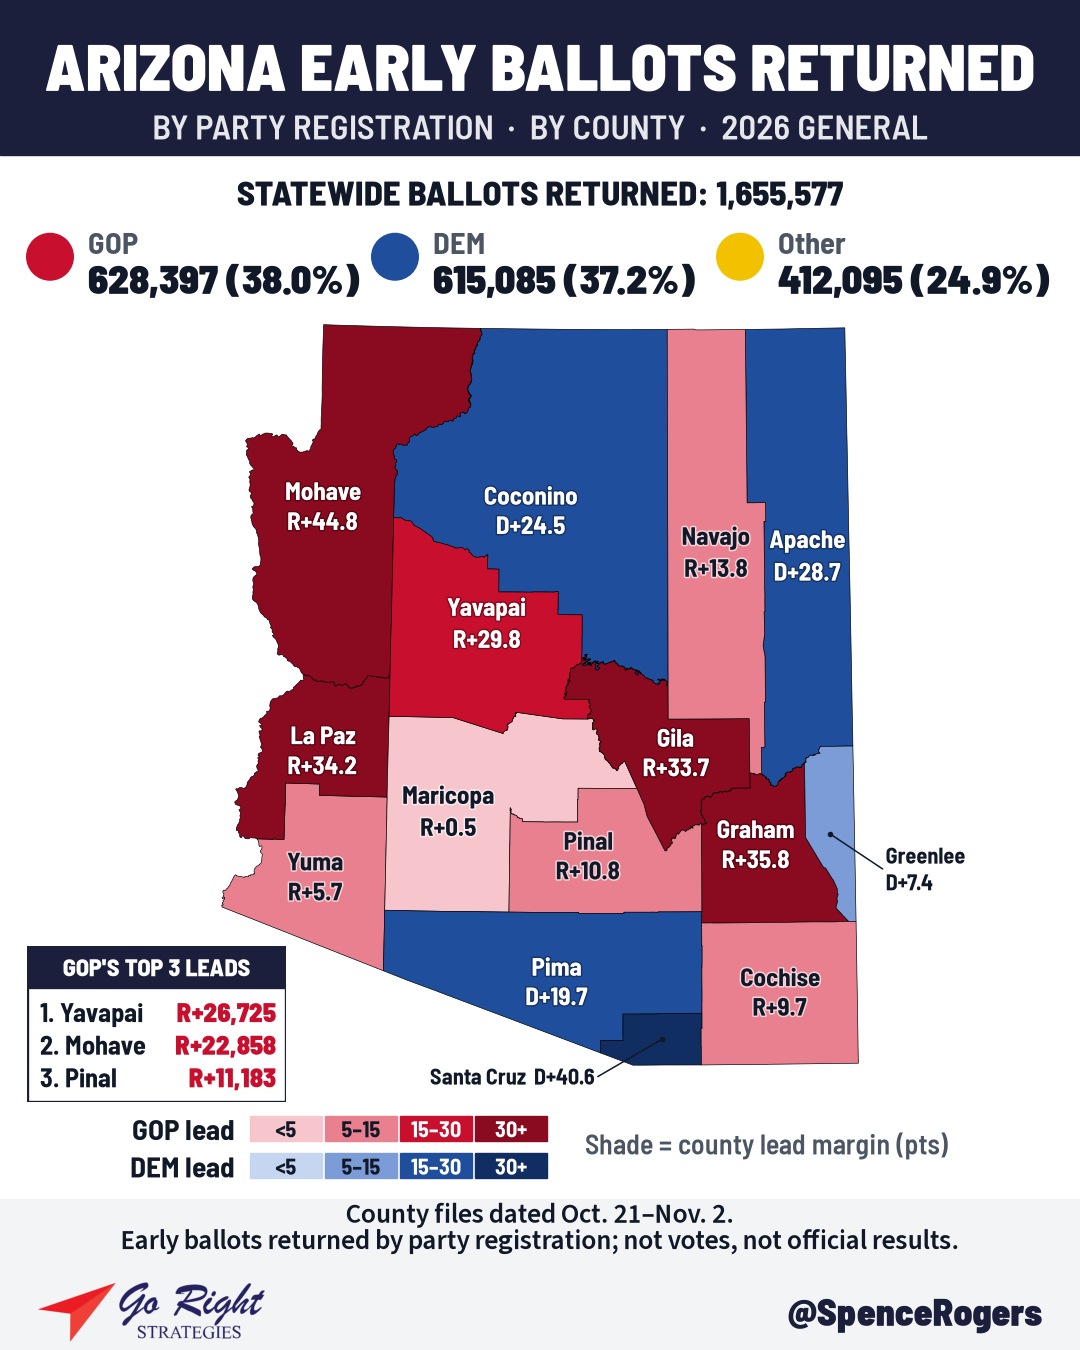
The trend, day by day
Running statewide totals of early ballots returned, by party registration.
| Date | 🔴 GOP | 🔵 DEM | 🟡 Other | Total | Lead |
|---|---|---|---|---|---|
| Oct. 20 | 194,727 | 204,584 | 115,594 | 514,905 | D+9,857 |
| Oct. 21 | 209,143 | 212,344 | 121,745 | 543,232 | D+3,201 |
| Oct. 22 | 282,739 | 288,059 | 168,835 | 739,633 | D+5,320 |
| Oct. 23 | 327,978 | 327,494 | 195,228 | 850,700 | R+484 |
| Oct. 24 | 332,929 | 330,565 | 197,644 | 861,138 | R+2,364 |
| Oct. 25 | 339,414 | 342,175 | 202,885 | 884,474 | D+2,761 |
| Oct. 26 | 361,264 | 360,335 | 216,051 | 937,650 | R+929 |
| Oct. 27 | 435,817 | 424,303 | 262,096 | 1,122,216 | R+11,514 |
| Oct. 28 | 489,430 | 478,480 | 302,018 | 1,269,928 | R+10,950 |
| Oct. 29 | 552,120 | 538,594 | 350,472 | 1,441,186 | R+13,526 |
| Oct. 30 | 585,570 | 575,936 | 379,681 | 1,541,187 | R+9,634 |
| Oct. 31 | 607,341 | 593,456 | 394,139 | 1,594,936 | R+13,885 |
| Nov. 1 | 609,283 | 596,948 | 396,476 | 1,602,707 | R+12,335 |
| Nov. 2 | 625,143 | 613,185 | 409,869 | 1,648,197 | R+11,958 |
| Nov. 3 | 628,397 | 615,085 | 412,095 | 1,655,577 | R+13,312 |
The table covers 15 daily snapshots. Democratic-registered voters had returned 9,857 more ballots in the first one, and Republican-registered voters have been ahead in every snapshot since Oct. 26, by as many as 13,885 on Oct. 31. The Republican edge now stands at 13,312, up 1,354 from the Nov. 2 update and 573 below that Oct. 31 figure, with the two parties’ shares of all ballots returned at 38.0% and 37.2%.
What changed since the Nov. 2 update
Statewide, 7,380 more returned ballots came in, for 1,655,577, and the Republican edge in returned ballots by party registration grew from 11,958 to 13,312, a change of 1,354. Four counties posted new numbers, and all four moved toward Republicans. Pinal’s 6,159 new ballots came from 2,551 Republican-registered voters, 1,676 Democratic-registered voters and 1,932 others, so its Republican edge grew by 875, to 11,183. Gila’s 756 new ballots widened its Republican edge by 320, to 5,193, which now tops Maricopa’s. La Paz’s 366 new ballots widened its Republican edge by 142, to 1,083. In Greenlee, 99 new ballots trimmed the Democratic edge by 17, to 91. Maricopa’s Republican edge is unchanged at 5,029, and the other 10 counties have posted nothing new since the Nov. 2 update.
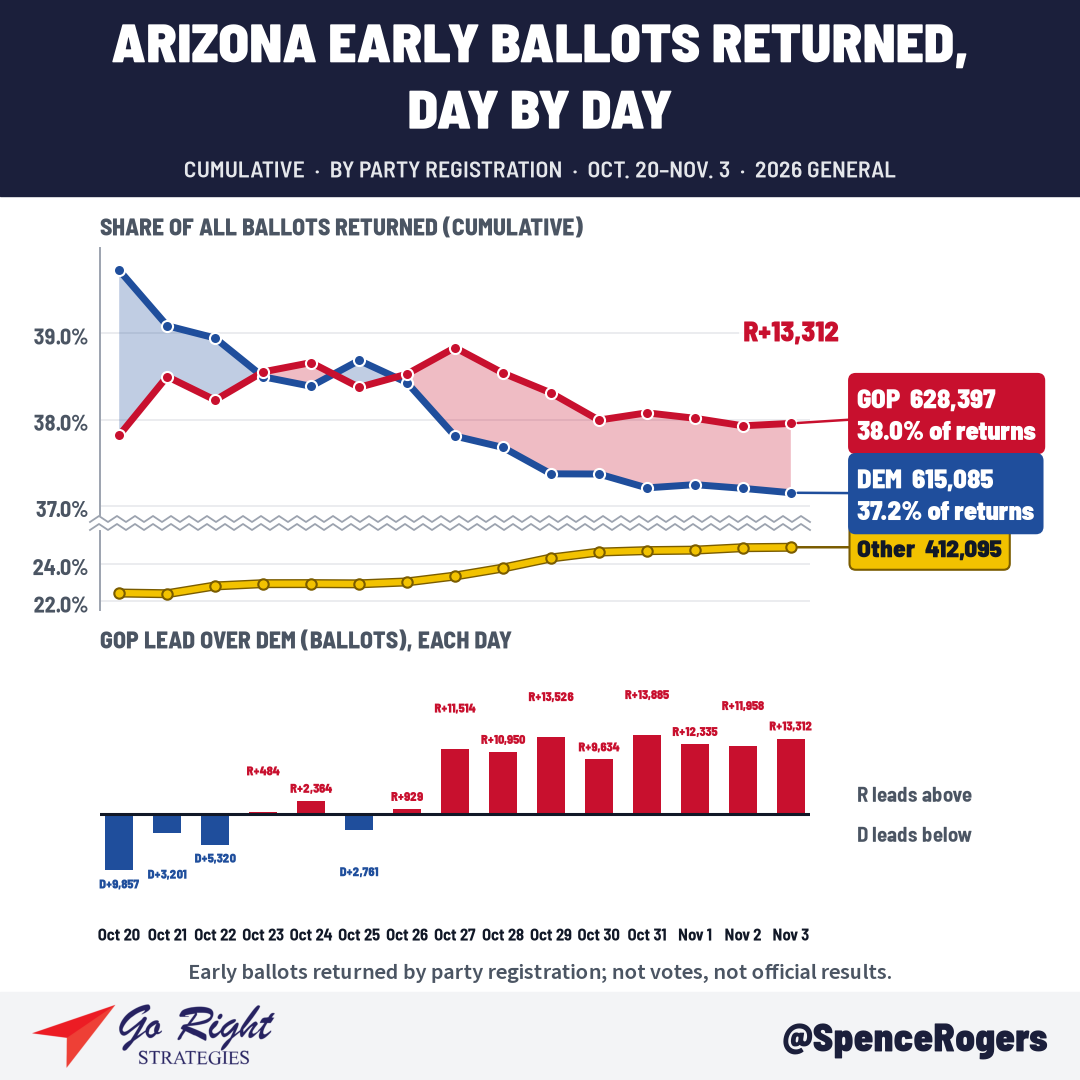
All 15 counties at a glance
Each county reports on its own schedule. The “Updated” column shows when we last pulled new numbers for each county, in Eastern time. A time alone means the same day as the update at the top of this page. A date means an earlier day, because that county hasn’t posted anything newer.
On a phone, swipe the table sideways to see Total, Lead and Updated.
| County | 🔴 GOP | 🔵 DEM | 🟡 Other | Total | Lead | Updated |
|---|---|---|---|---|---|---|
| Apache | 3,369 (27.0%) | 6,941 (55.7%) | 2,157 (17.3%) | 12,467 | D+3,572 | Oct. 31, 9:43 p.m. |
| Cochise | 12,419 (41.4%) | 9,509 (31.7%) | 8,049 (26.9%) | 29,977 | R+2,910 | Oct. 31, 11:27 a.m. |
| Coconino | 8,759 (25.1%) | 17,318 (49.5%) | 8,882 (25.4%) | 34,959 | D+8,559 | Nov. 2, 11:36 a.m. |
| Gila | 8,736 (56.7%) | 3,543 (23.0%) | 3,126 (20.3%) | 15,405 | R+5,193 | Nov. 3, 11:38 a.m. |
| Graham | 3,454 (59.9%) | 1,392 (24.1%) | 920 (16.0%) | 5,766 | R+2,062 | Oct. 31, 11:27 a.m. |
| Greenlee | 432 (35.2%) | 523 (42.7%) | 271 (22.1%) | 1,226 | D+91 | Nov. 3, 11:38 a.m. |
| La Paz | 1,751 (55.3%) | 668 (21.1%) | 745 (23.5%) | 3,164 | R+1,083 | Nov. 3, 11:38 a.m. |
| Maricopa | 365,421 (37.6%) | 360,392 (37.0%) | 247,322 (25.4%) | 973,135 | R+5,029 | Nov. 2, 11:36 a.m. |
| Mohave | 31,709 (62.1%) | 8,851 (17.3%) | 10,506 (20.6%) | 51,066 | R+22,858 | Oct. 31, 9:43 p.m. |
| Navajo | 9,603 (47.3%) | 6,793 (33.4%) | 3,919 (19.3%) | 20,315 | R+2,810 | Oct. 31, 11:27 a.m. |
| Pima | 77,579 (27.7%) | 132,622 (47.4%) | 69,800 (24.9%) | 280,001 | D+55,043 | Nov. 2, 11:36 a.m. |
| Pinal | 44,007 (42.3%) | 32,824 (31.6%) | 27,116 (26.1%) | 103,947 | R+11,183 | Nov. 3, 11:38 a.m. |
| Santa Cruz | 505 (18.9%) | 1,594 (59.5%) | 580 (21.6%) | 2,679 | D+1,089 | Oct. 23, 11:38 a.m. |
| Yavapai | 47,687 (53.2%) | 20,962 (23.4%) | 21,000 (23.4%) | 89,649 | R+26,725 | Oct. 31, 9:43 p.m. |
| Yuma | 12,966 (40.7%) | 11,153 (35.0%) | 7,702 (24.2%) | 31,821 | R+1,813 | Nov. 2, 11:36 a.m. |
| Statewide | 628,397 (38.0%) | 615,085 (37.2%) | 412,095 (24.9%) | 1,655,577 | R+13,312 |
County by county: GOP leads, then Dem leads
Yavapai County: R+26,725
Updated Oct. 31, 2026, 9:43 p.m. ET
🔴 GOP 47,687 (53.2%)
🔵 DEM 20,962 (23.4%)
🟡 Other 21,000 (23.4%)
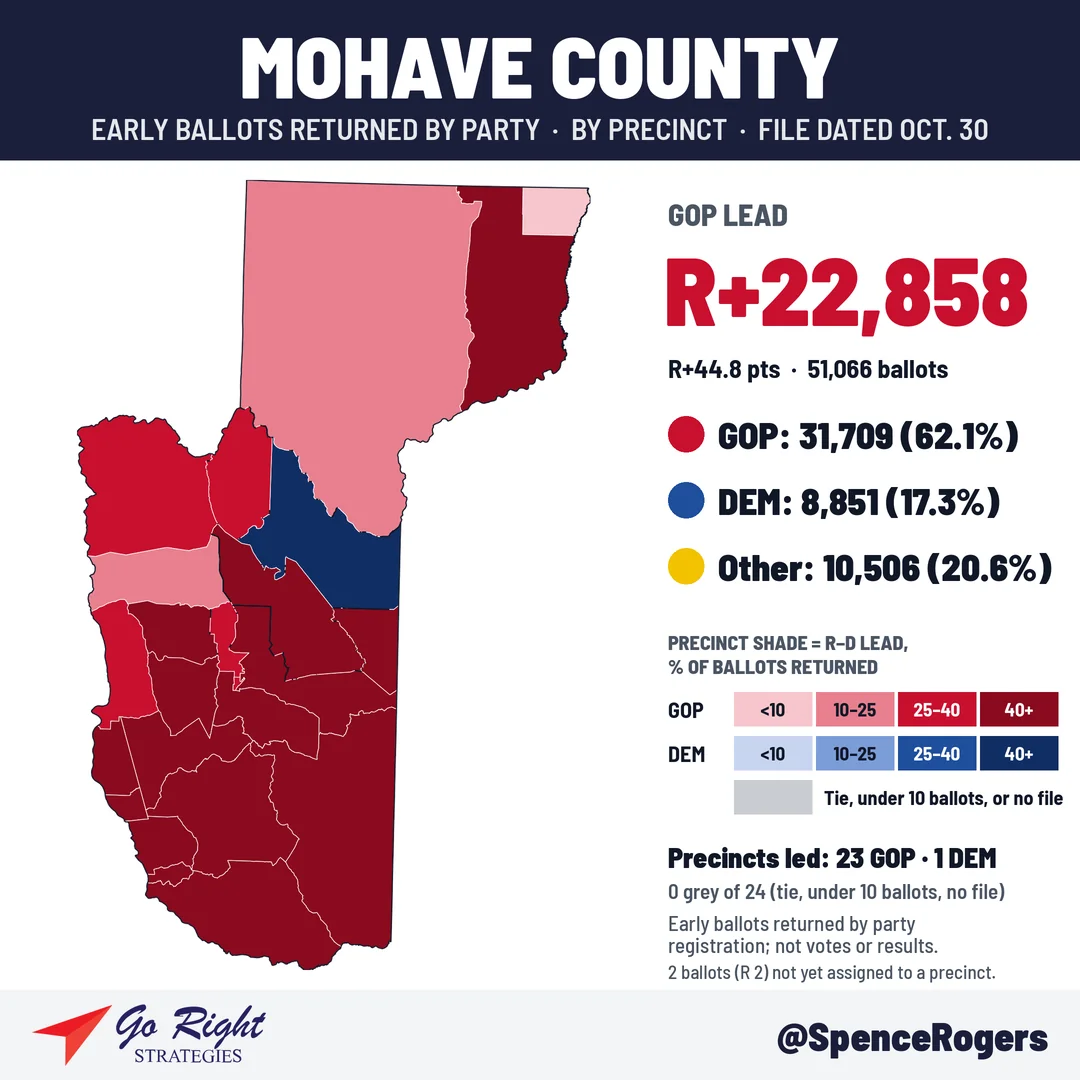
Mohave County: R+22,858
Updated Oct. 31, 2026, 9:43 p.m. ET
🔴 GOP 31,709 (62.1%)
🔵 DEM 8,851 (17.3%)
🟡 Other 10,506 (20.6%)
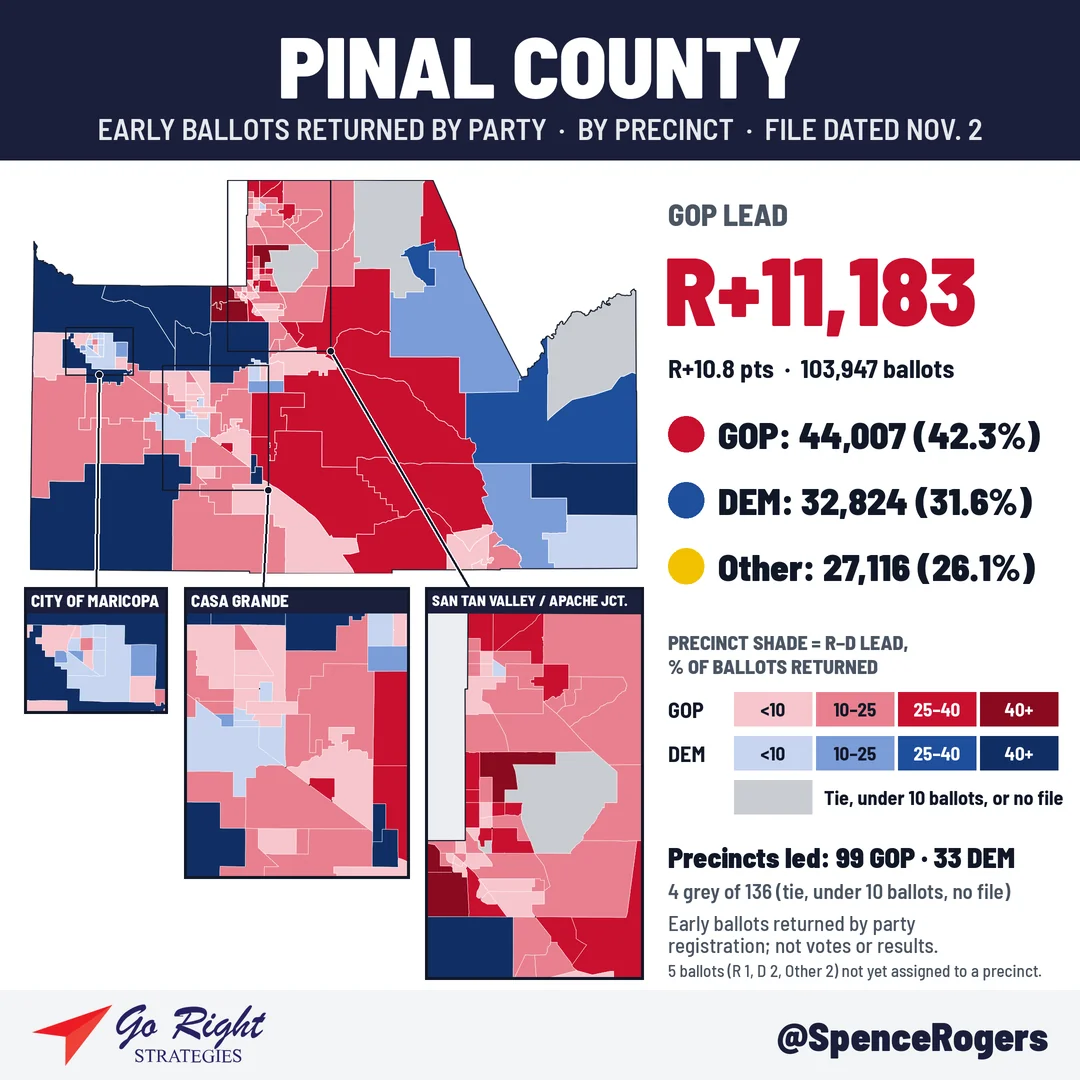
Pinal County: R+11,183
Updated Nov. 3, 2026, 11:38 a.m. ET
🔴 GOP 44,007 (42.3%)
🔵 DEM 32,824 (31.6%)
🟡 Other 27,116 (26.1%)
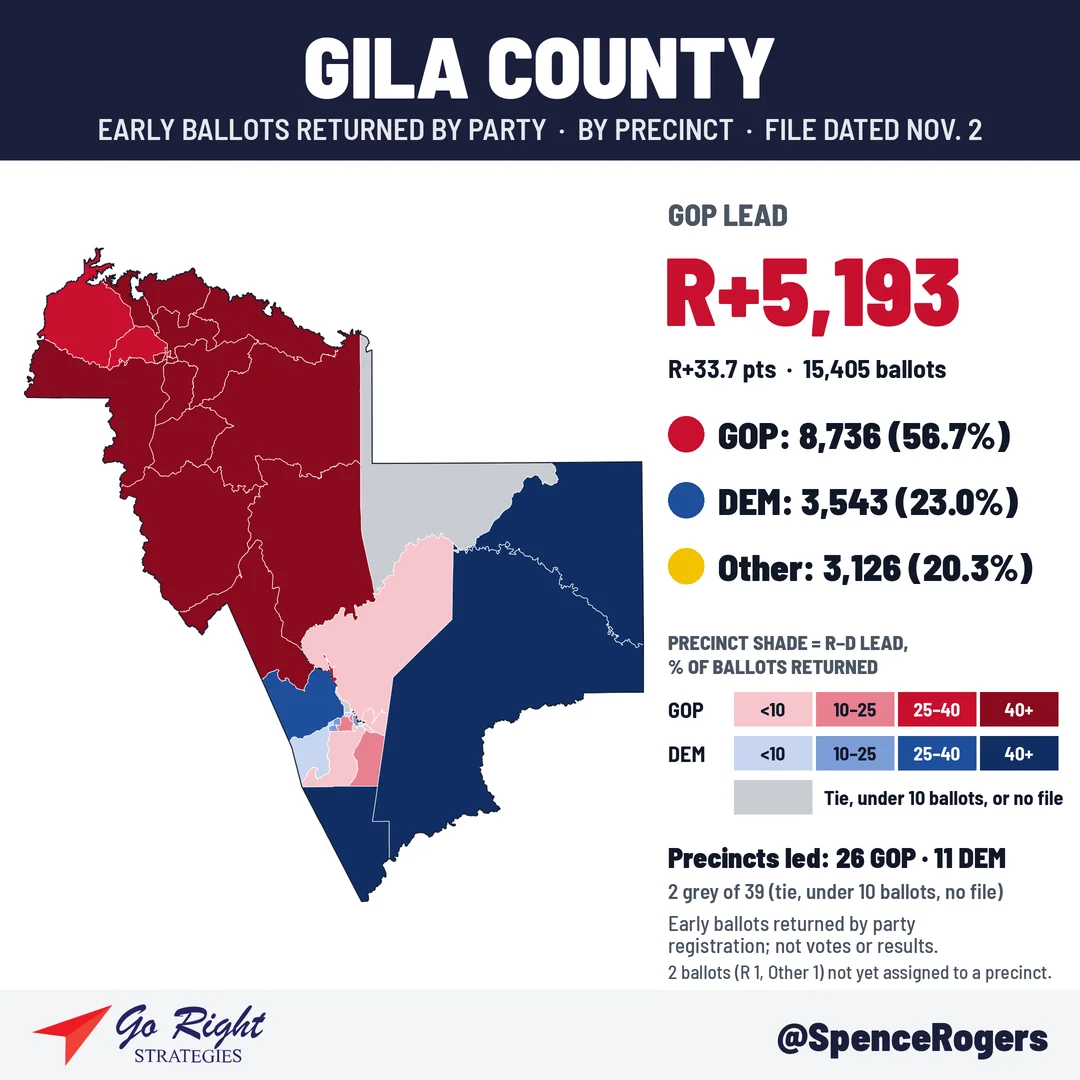
Gila County: R+5,193
Updated Nov. 3, 2026, 11:38 a.m. ET
🔴 GOP 8,736 (56.7%)
🔵 DEM 3,543 (23.0%)
🟡 Other 3,126 (20.3%)
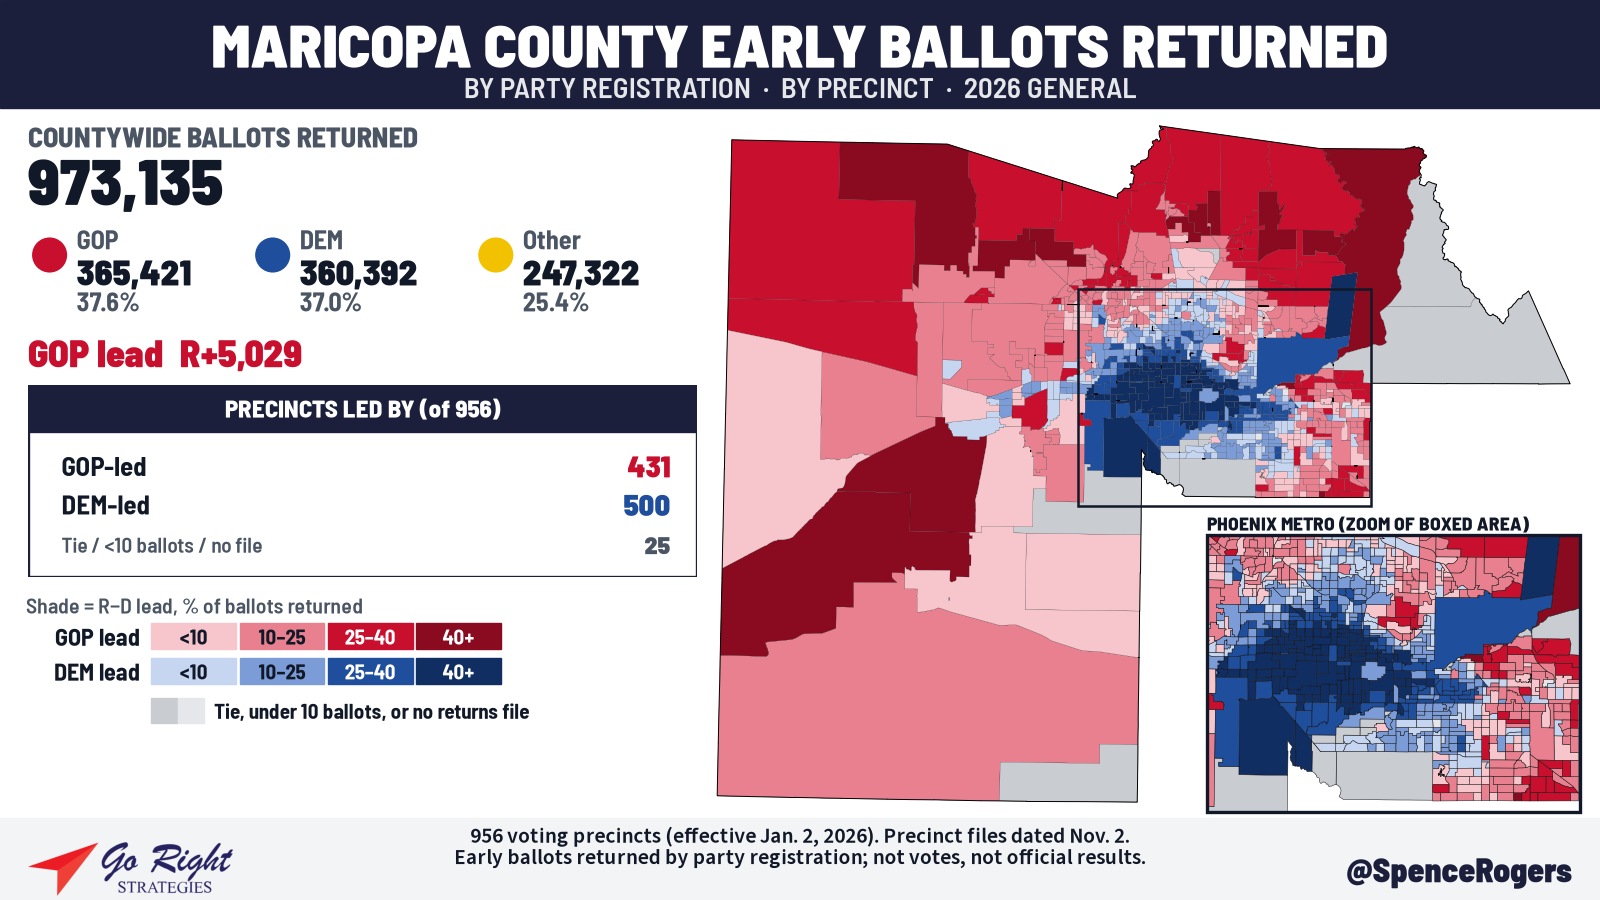
Maricopa County: R+5,029
Updated Nov. 2, 2026, 11:36 a.m. ET
🔴 GOP 365,421 (37.6%)
🔵 DEM 360,392 (37.0%)
🟡 Other 247,322 (25.4%)
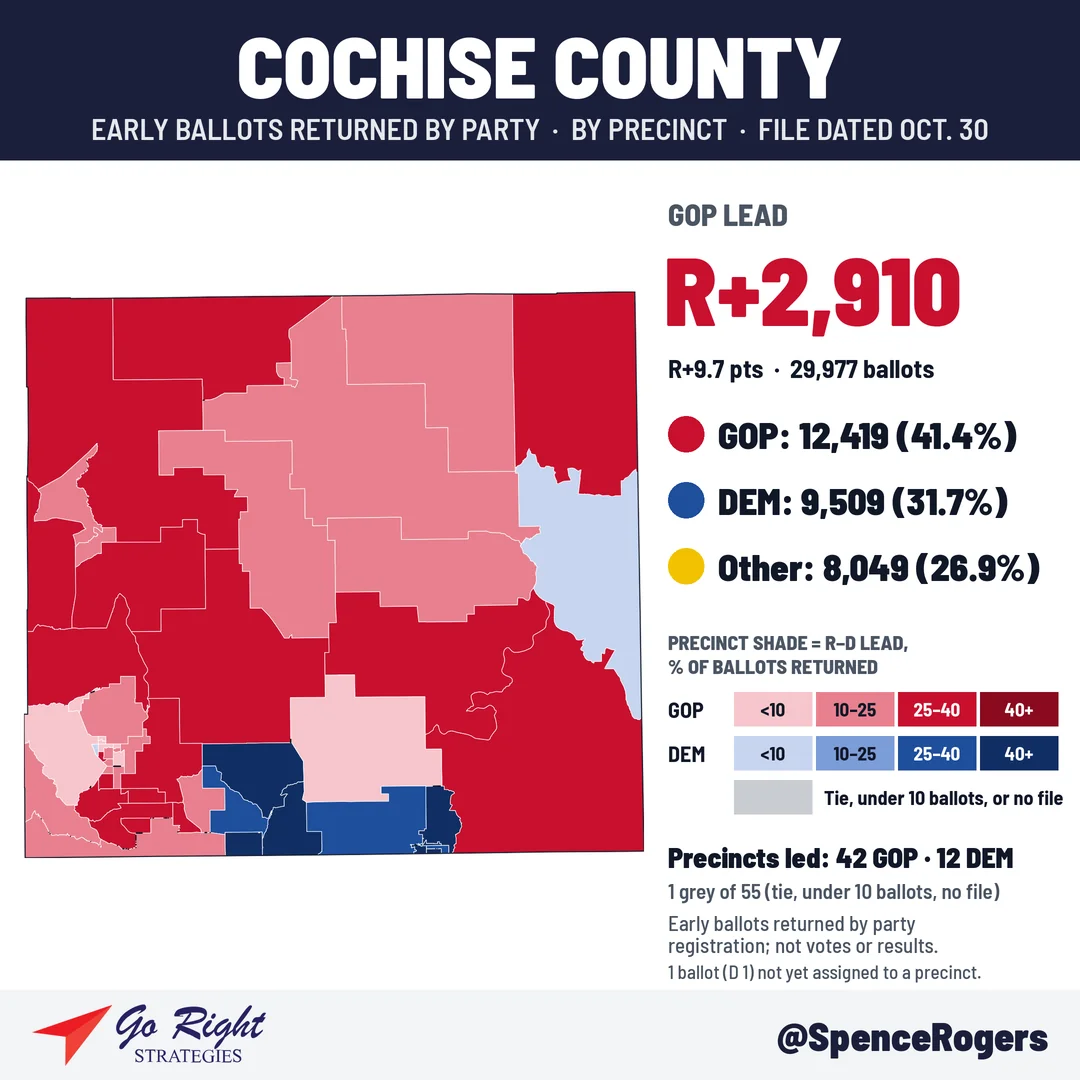
Cochise County: R+2,910
Updated Oct. 31, 2026, 11:27 a.m. ET
🔴 GOP 12,419 (41.4%)
🔵 DEM 9,509 (31.7%)
🟡 Other 8,049 (26.9%)
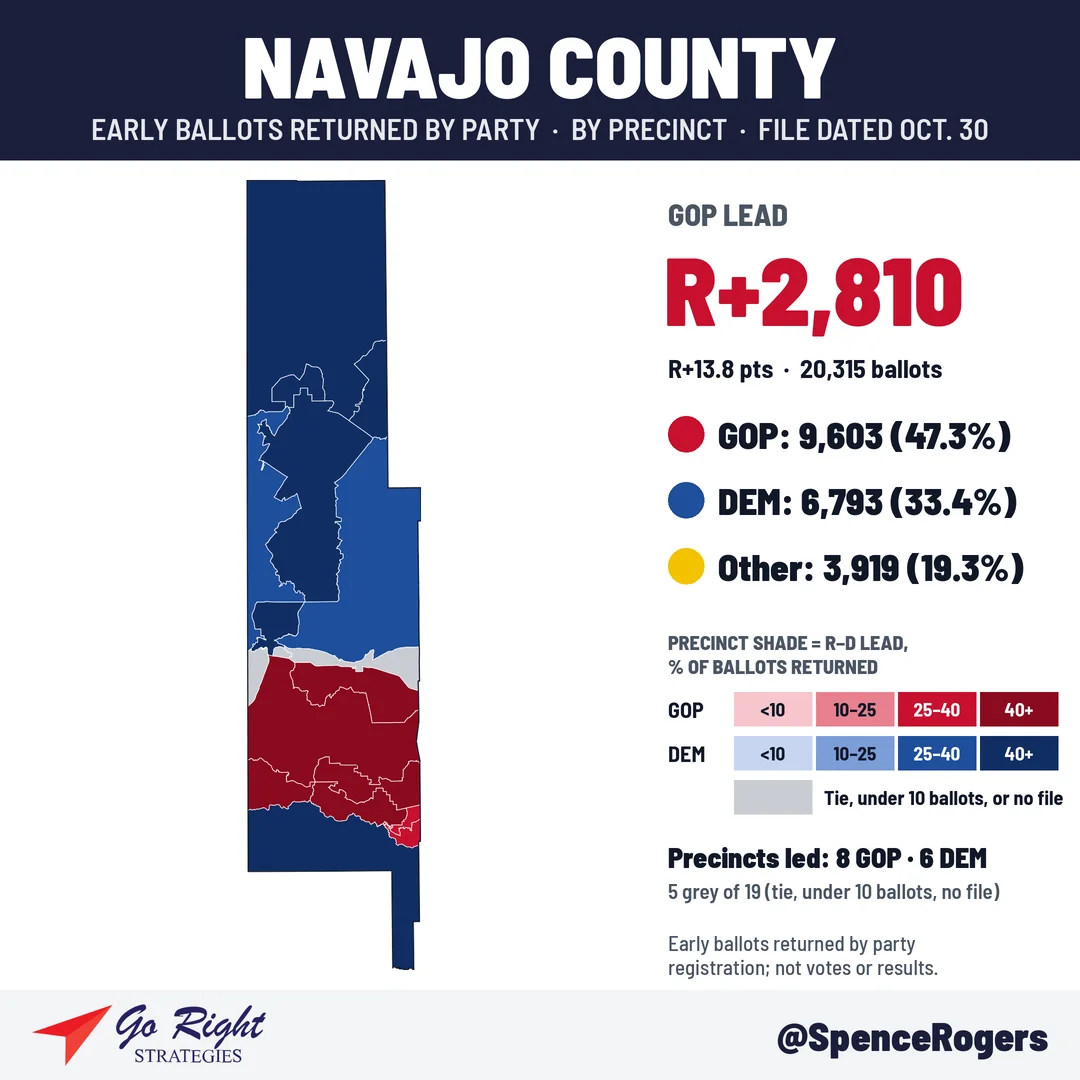
Navajo County: R+2,810
Updated Oct. 31, 2026, 11:27 a.m. ET
🔴 GOP 9,603 (47.3%)
🔵 DEM 6,793 (33.4%)
🟡 Other 3,919 (19.3%)
Graham County: R+2,062
Updated Oct. 31, 2026, 11:27 a.m. ET
🔴 GOP 3,454 (59.9%)
🔵 DEM 1,392 (24.1%)
🟡 Other 920 (16.0%)
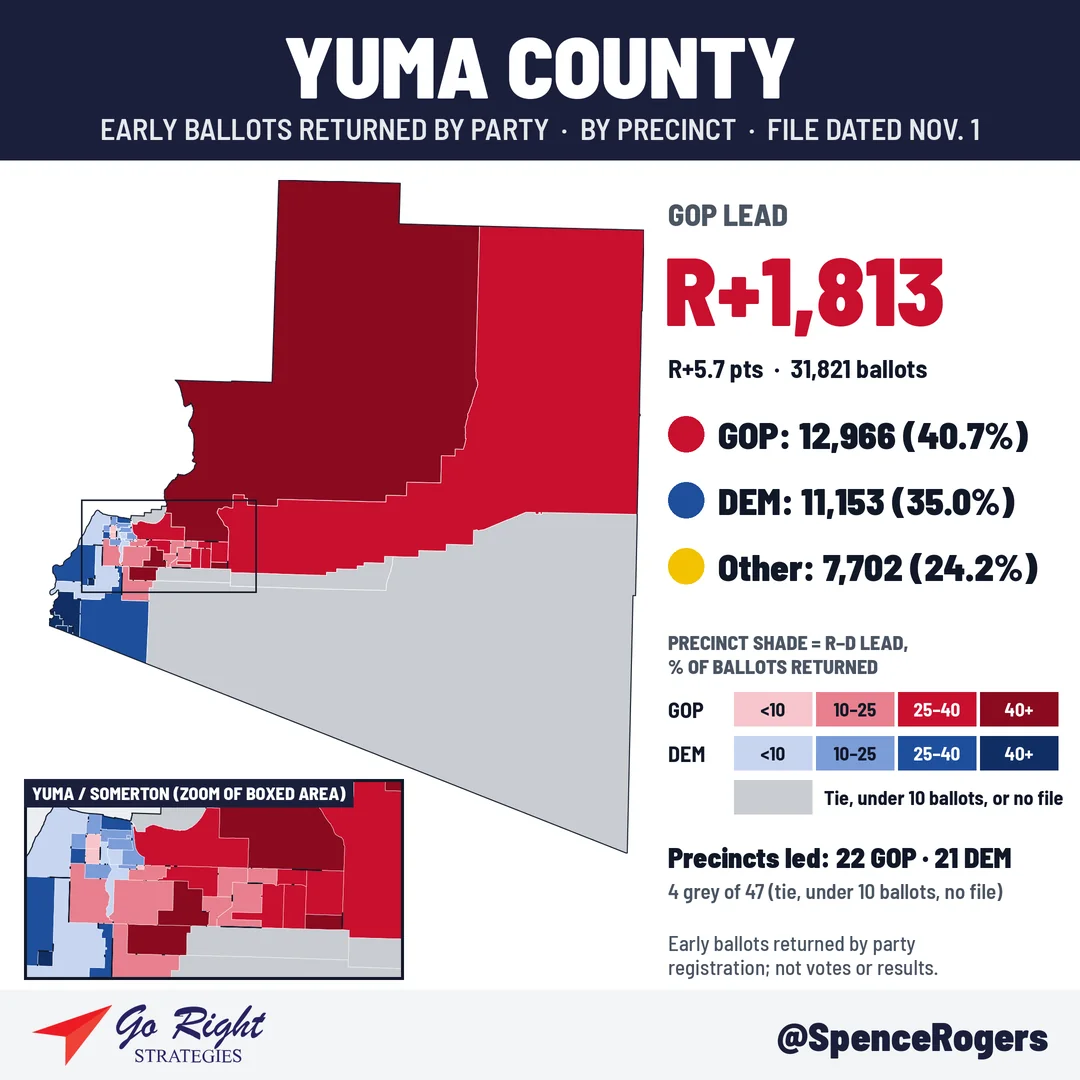
Yuma County: R+1,813
Updated Nov. 2, 2026, 11:36 a.m. ET
🔴 GOP 12,966 (40.7%)
🔵 DEM 11,153 (35.0%)
🟡 Other 7,702 (24.2%)
La Paz County: R+1,083
Updated Nov. 3, 2026, 11:38 a.m. ET
🔴 GOP 1,751 (55.3%)
🔵 DEM 668 (21.1%)
🟡 Other 745 (23.5%)
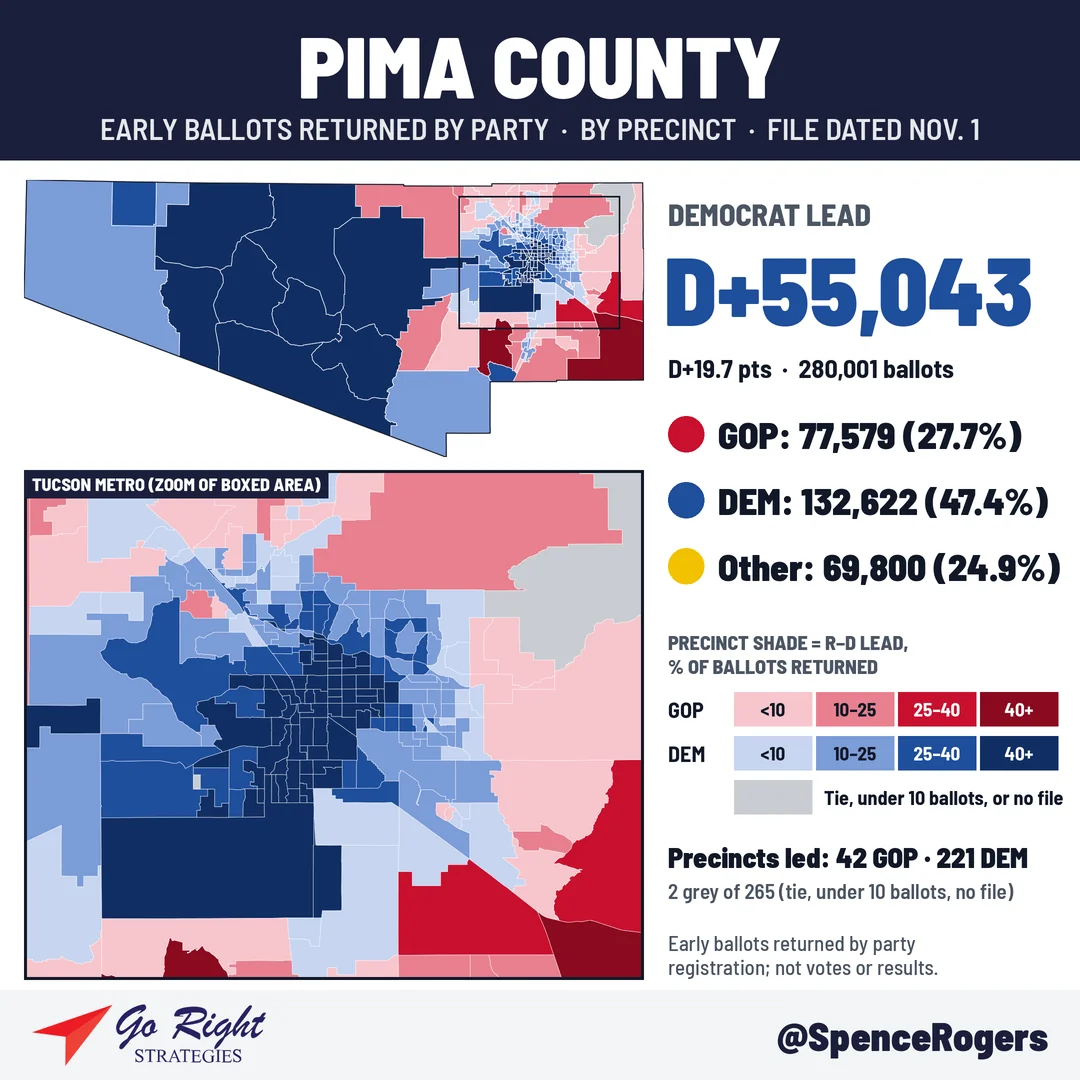
Pima County: D+55,043
Updated Nov. 2, 2026, 11:36 a.m. ET
🔴 GOP 77,579 (27.7%)
🔵 DEM 132,622 (47.4%)
🟡 Other 69,800 (24.9%)
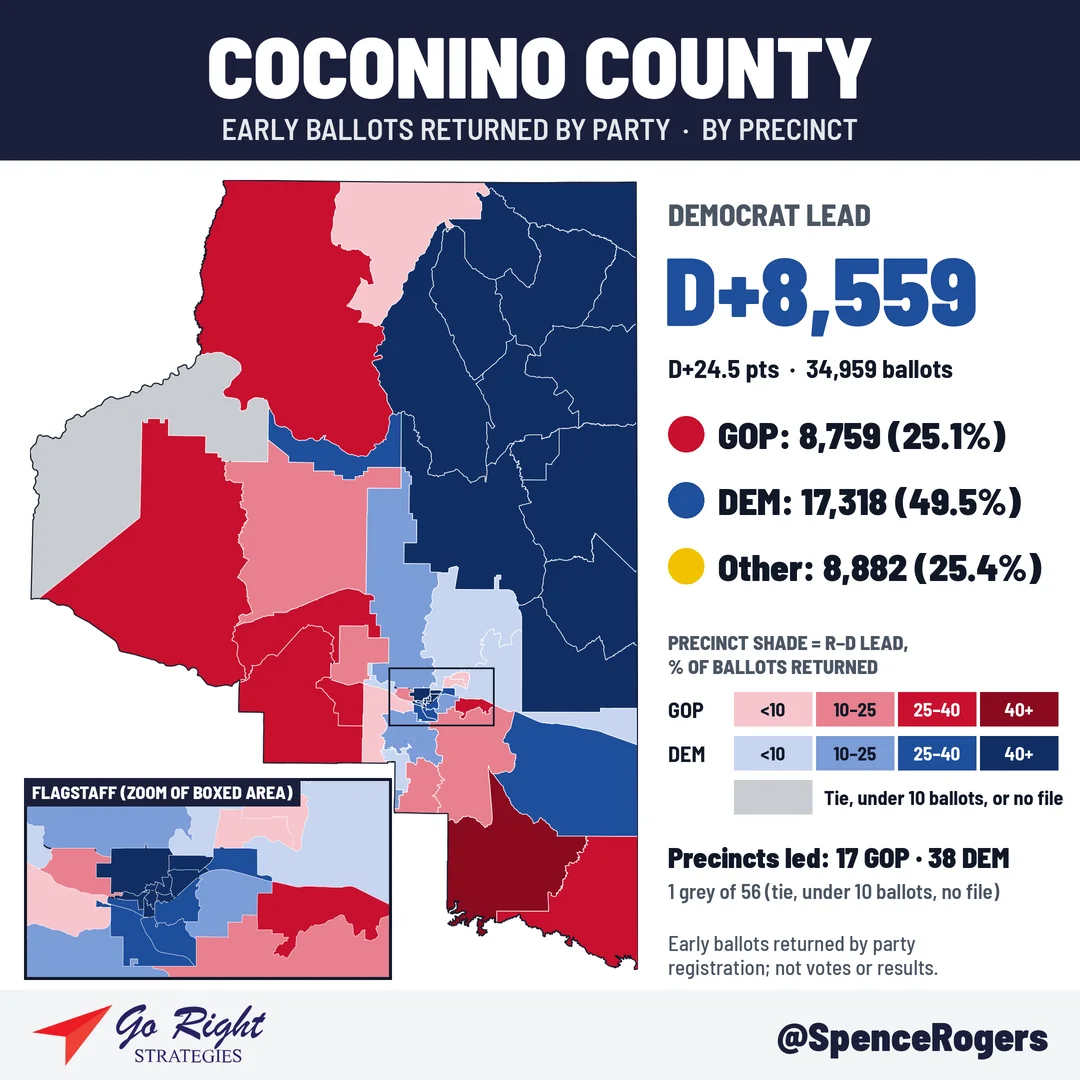
Coconino County: D+8,559
Updated Nov. 2, 2026, 11:36 a.m. ET
🔴 GOP 8,759 (25.1%)
🔵 DEM 17,318 (49.5%)
🟡 Other 8,882 (25.4%)
Apache County: D+3,572
Updated Oct. 31, 2026, 9:43 p.m. ET
🔴 GOP 3,369 (27.0%)
🔵 DEM 6,941 (55.7%)
🟡 Other 2,157 (17.3%)
Santa Cruz County: D+1,089
Updated Oct. 23, 2026, 11:38 a.m. ET
🔴 GOP 505 (18.9%)
🔵 DEM 1,594 (59.5%)
🟡 Other 580 (21.6%)
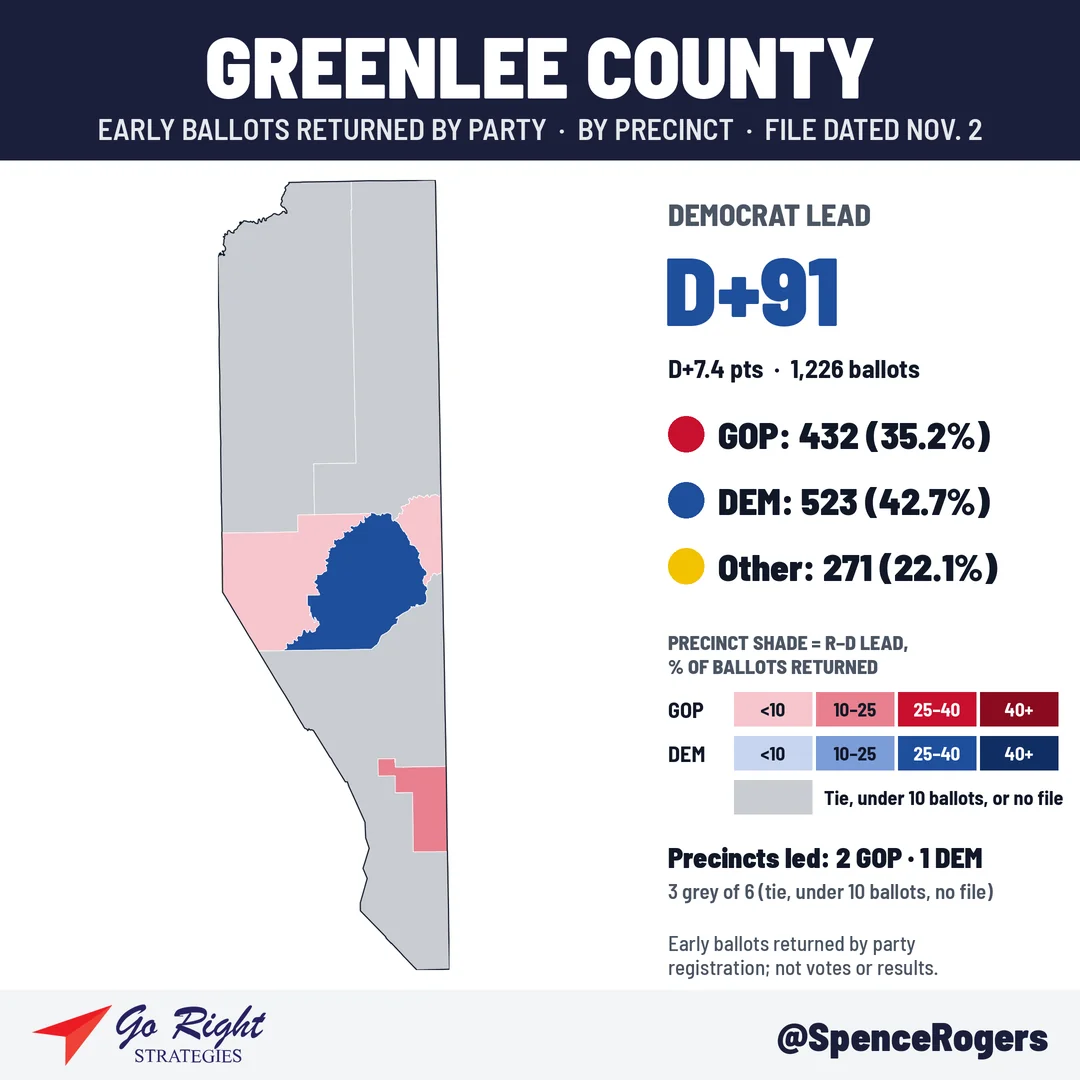
Greenlee County: D+91
Updated Nov. 3, 2026, 11:38 a.m. ET
🔴 GOP 432 (35.2%)
🔵 DEM 523 (42.7%)
🟡 Other 271 (22.1%)
Key deadlines
It’s too late to mail your early ballot, because Arizona counts ballots that arrive by 7 p.m. today, not ones postmarked by then. Sign and seal it, then drop it off at any voting location, official ballot drop box or County Recorder’s office in your county by 7 p.m. Arizona time. You can skip the voting line and put it straight in the early ballot bin, according to the Arizona Secretary of State and the Citizens Clean Elections Commission.
Early ballot still at home? Your options today
Don’t mail it. Your county must receive it by 7 p.m. Arizona time today. Postmarks don’t count.
- Filled out and signed: drop it at any official drop box or voting location in your county by 7 p.m.
- Not filled out yet: bring the ballot and its envelope to a voting location. Mark it in a privacy booth there, sign the envelope and drop it in the early ballot box.
- Lost it, or rather vote in person: it’s too late for a mailed replacement, so vote at a voting location with ID. Depending on your county’s records, you’ll get a regular ballot or a provisional ballot. Find your location at my.arizona.vote, or in Maricopa County at Maricopa County Elections and in Pima County at pima.vote.
- In line at 7 p.m.: stay in line. You can still vote.
Already dropped it off? Check its status on the Arizona Voter Dashboard.
Source: Arizona Secretary of State, Arizona Secretary of State news release, A.R.S. 16-547, A.R.S. 16-579, A.R.S. 16-565, Maricopa County Recorder.
Too late to mail it: drop off your ballot by 7 p.m. Nov. 3
The last recommended day to mail an early ballot has passed. Postmarks don’t count, and your county has to receive your ballot by 7 p.m. Arizona time on Election Day, Tuesday, Nov. 3. If yours is still on the kitchen counter, sign it, seal it and drop it at an official drop box, voting location or vote center. Maricopa County drop boxes take ballots until 7 p.m. on Nov. 3, and Pima County’s nine drop boxes are open 24 hours a day until then.
New this year: show ID when you drop off your early ballot
Still have your early ballot? Don’t mail it. The last recommended mail-back day was Oct. 27, postmarks don’t count, and your county has to receive it by 7 p.m. Arizona time on Election Day, Tuesday, Nov. 3. Drop it at any official drop box or any voting location in your county. Polling places are open 6 a.m. to 7 p.m. New in 2026, you can bring your own signed, sealed ballot to a polling place in your county and show a valid ID. In Maricopa and Pima counties, staff stamp it ID Verified so it skips signature verification, and in Maricopa you can tabulate it on-site on Election Day. Can’t get there? A family member, household member or caregiver can drop it off for you. In Pima, the ID option is only for your own ballot.
Source: Arizona Secretary of State, A.R.S. 16-547, Maricopa County Recorder, Pima County.
Before you drop it off: sign it, date it and add your phone number
Only you can sign your early ballot envelope, so sign and date it yourself and write your phone number on it. That number is how your county reaches you if there’s a problem with your signature. If you forget to sign, your county will try to contact you, and you have until 7 p.m. Arizona time on Election Day, Tuesday, Nov. 3, to add your signature. If your county can’t match your signature, it will try to contact you by phone, text, email or mail, and you have until 5 p.m. Arizona time on Sunday, Nov. 8, to confirm it. If no one contacts you, you don’t need to do anything, but you can check your ballot’s status at my.arizona.vote.
Source: Maricopa County Recorder, A.R.S. 16-550.
- Today, until 7 p.m. Arizona time: drop your signed, sealed ballot at an official drop box, voting location or vote center.
- Election Day, Tuesday, Nov. 3: polls are open 6 a.m. to 7 p.m. Arizona time, and every ballot must be received by 7 p.m. If you’re in line at a vote center by 7 p.m., you can still vote.
- Fixing a signature problem: if your county flags your signature, you have until 5 p.m. on Nov. 8 to fix it.
Sources: Arizona Secretary of State, Maricopa County Recorder, Pima County Recorder’s Office, Arizona Secretary of State election calendar, Arizona Secretary of State early voting procedures, A.R.S. 16-542, Pima County Recorder early and emergency voting sites, Maricopa County Elections Department.
How to check your ballot status
Don’t assume your ballot got counted. Check it.
- Any Arizona county: look up your ballot on the Secretary of State’s Arizona Voter Dashboard. It shows when your ballot was mailed to you, when the County Recorder received it, and whether it was accepted and your signature verified.
- Text and email alerts: sign up at trackmyballot.azsos.gov.
- Maricopa County: use BeBallotReady.vote, or text JOIN to 628-683 for updates.
- Pima County: use the Pima County Recorder’s ballot lookup.
What these numbers mean, and what they don’t
- These are ballots returned, not votes. Each ballot is counted under the party the voter is registered with. A registered Republican’s ballot goes in the 🔴 column no matter who they voted for. Nobody knows how anyone voted until the ballots are counted.
- “Other” covers independents, voters with no party, and smaller parties. In Arizona, that’s nearly a quarter of everyone who has returned a ballot, and they decide close races.
- These are not election results. Unofficial results start coming from county election officials on election night, after the polls close at 7 p.m. Arizona time on Nov. 3. State law bars releasing early-ballot tallies until all precincts have reported or one hour after the polls close, whichever comes first. The state certifies official results at its Nov. 23 canvass. No candidate’s vote totals are in these numbers.
- Counties update on different days. A county that hasn’t reported in a few days will be undercounted until it does. Watch the “Updated” column.
- Numbers can move a lot in one day. One big county update, like Maricopa’s or Pima’s, can flip the statewide lead overnight. The trend matters more than any single day.
Bottom line: a statewide lead this thin gets won at the drop box. If you have a ballot on your kitchen counter, drop it off by 7 p.m. Arizona time today.
See our campaign services if you’d like help turning these numbers into a ballot-chase plan for your Republican campaign in Arizona.
Data: compiled from county early ballot return files, by party registration. This is not an official state or county release. Counts for each county are as of the time shown in the table above. Updated daily.