
LD 7 live results
Updated 7:19 a.m. ET, Wed., Nov. 4, 2026
Unofficial results as posted by the Arizona Secretary of State. Numbers change as counties count more ballots. Margin = Republican minus Democratic votes.
State Senate, LD 7
🔴 Wendy Rogers (Rep.): 49,166 (59.8%)
🔵 Michiel "Mike" Montiel (Dem.): 32,933 (40.1%)
🟡 Write-in candidates (Write-in): 89 (0.1%)
Votes posted: 82,188
Reporting units posted: 4 of 4
Margin: Wendy Rogers (Rep.) has 16,233 more votes than Michiel "Mike" Montiel (Dem.) (19.8 pts), of 82,188 votes counted
State House, LD 7
🔴 Walter "Walt" Blackman (Rep.): 46,154 (34.5%)
🔴 David Cook Sr. (Rep.): 44,334 (33.2%)
🔵 Samuel "Sam" Martin (Dem.): 31,877 (23.8%)
🟡 Richard Grayson (Green): 11,213 (8.4%)
🟡 Write-in candidates (Write-in): 119 (0.1%)
Votes posted: 133,697
Reporting units posted: 4 of 4
Voters choose 2 House members. Percent = share of all House votes cast in the district.
Source: Arizona Secretary of State. Unofficial results.
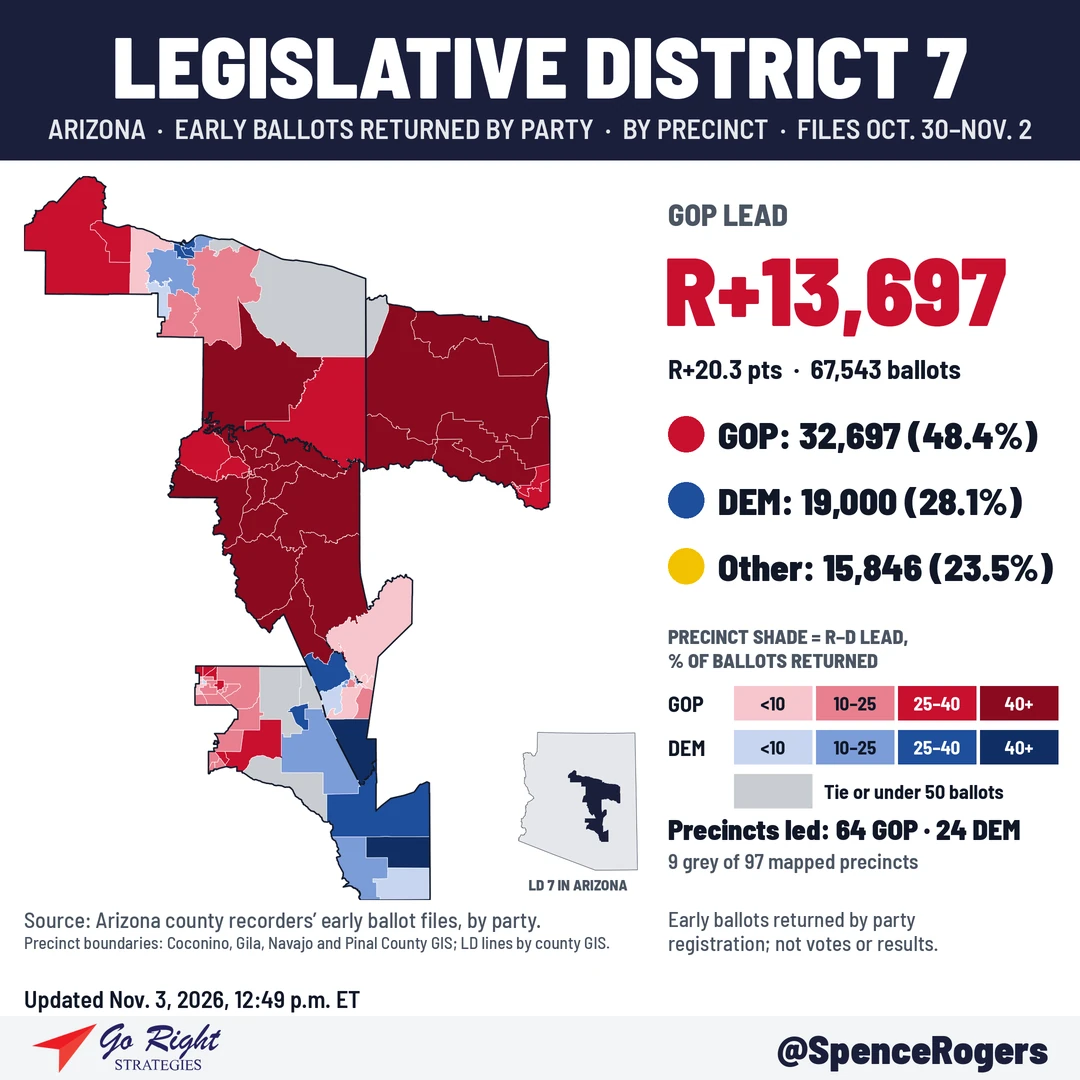
Updated Nov. 3, 2026, 12:49 p.m. ET
🔴 Republicans: 32,697 (48.4%)
🔵 Democrats: 19,000 (28.1%)
🟡 Other: 15,846 (23.5%)
Total returned: 67,543
Margin: R+13,697
Percentages are rounded and may not add to 100%.
Election Day analysis
Updated Nov. 3, 2026, 2:06 p.m. ET
No Election Day turnout by party is posted yet. Arizona counties do not post in-person Election Day turnout by party during the day. Polls close at 7 p.m. Arizona time (9 p.m. ET). Voters can still drop off early ballots at any voting location in their county until 7 p.m. Arizona time.
Election Day turnout so far (county counts)
Pinal County: more than 10,000 Election Day check-ins, posted 12:41 p.m. ET. Countywide, not LD only.
Coconino County: Election Day count: not posted by Coconino County as of 2:00 p.m. ET.
Gila County: Election Day count: not posted by Gila County as of 2:00 p.m. ET.
Navajo County: Election Day count: not posted by Navajo County as of 2:00 p.m. ET.
Source: Arizona county recorders. Pinal figure posted by the Pinal County Recorder (Pinal VOTES). These are turnout counts, not votes, with no party breakdown. Counts are early in the day and will rise.
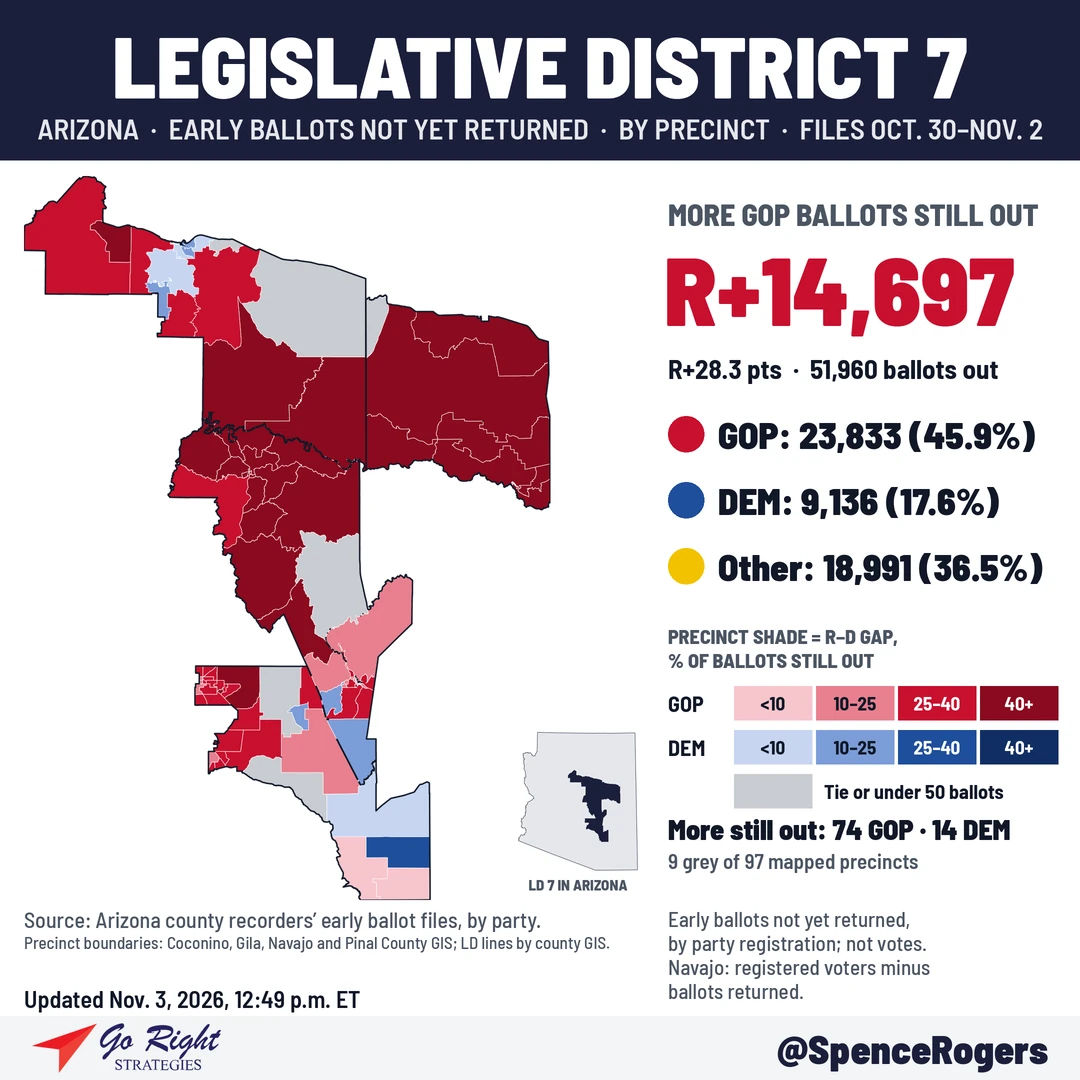
Precinct boundaries: Coconino, Gila, Navajo and Pinal County GIS.
Navajo County precincts are grouped by the county's official precinct map, which places each precinct wholly in one district and matches the Arizona Independent Redistricting Commission's 2022 map; the county early ballot file's grouping was not used because it lists more Republican early ballots in LD 6 than Navajo County's LD 6 precincts have registered Republicans.
In Navajo County, 'not yet returned' is registered voters minus ballots returned, because the county file lists ballots issued equal to registered voters.
Early ballots sent but not yet returned in LD 7
🔴 Republicans: 23,833 (45.9%)
🔵 Democrats: 9,136 (17.6%)
🟡 Other: 18,991 (36.5%)
Total not yet returned: 51,960
Margin: R+14,697
Returned so far: 57.8% of Republican early ballots, 67.5% of Democratic early ballots, 45.5% of Other early ballots.
Not yet returned = early ballots sent minus early ballots returned, by party registration, from the same county files. Some of these voters will drop off their ballot today, some will vote in person, and some will not vote. These are not votes.
LD 7 precincts (97)
Gila County (36)
| Precinct | 🔴 GOP | 🔵 DEM | 🟡 Other | Total | Lead | % of early ballots returned |
|---|---|---|---|---|---|---|
| Star Valley | 1,064 | 214 | 296 | 1,574 | R+850 | 70.2% |
| Payson #3 | 1,025 | 289 | 372 | 1,686 | R+736 | 74.8% |
| Payson #2 | 673 | 168 | 253 | 1,094 | R+505 | 68.8% |
| Payson #5 | 650 | 159 | 213 | 1,022 | R+491 | 68.5% |
| P/S West | 587 | 200 | 207 | 994 | R+387 | 67.6% |
| Tonto Basin | 448 | 90 | 119 | 657 | R+358 | 58.5% |
| Payson #8 | 474 | 154 | 184 | 812 | R+320 | 69.2% |
| Payson #1 | 421 | 106 | 140 | 667 | R+315 | 61.5% |
| Payson #6 | 358 | 97 | 118 | 573 | R+261 | 60.6% |
| Zane Grey | 245 | 38 | 66 | 349 | R+207 | 64.7% |
| Payson #4 | 332 | 131 | 123 | 586 | R+201 | 62.3% |
| Payson #7 | 275 | 82 | 89 | 446 | R+193 | 61.9% |
| P/S East | 221 | 63 | 82 | 366 | R+158 | 74.1% |
| Young | 150 | 24 | 49 | 223 | R+126 | 47.0% |
| Gisela | 147 | 42 | 55 | 244 | R+105 | 54.7% |
| Whispering Pines | 90 | 23 | 22 | 135 | R+67 | 60.0% |
| Roosevelt | 73 | 18 | 13 | 104 | R+55 | 61.2% |
| Sierra Ancha | 52 | 6 | 10 | 68 | R+46 | 60.2% |
| Globe #11 | 132 | 91 | 56 | 279 | R+41 | 58.5% |
| Claypool #1 | 110 | 78 | 50 | 238 | R+32 | 47.5% |
| Globe #6 | 150 | 123 | 69 | 342 | R+27 | 56.1% |
| Globe #1 | 112 | 87 | 54 | 253 | R+25 | 54.8% |
| Wheatfields | 35 | 15 | 13 | 63 | R+20 | 52.9% |
| Central Heights | 75 | 58 | 23 | 156 | R+17 | 50.5% |
| Globe #7 | 96 | 80 | 31 | 207 | R+16 | 67.6% |
| East Globe | 150 | 145 | 68 | 363 | R+5 | 58.0% |
| Pinal Creek | 52 | 52 | 16 | 120 | Tied | 62.5% |
| Claypool #2 | 95 | 99 | 53 | 247 | D+4 | 52.9% |
| Miami #3 | 57 | 61 | 31 | 149 | D+4 | 45.7% |
| Globe #2 | 37 | 43 | 16 | 96 | D+6 | 57.8% |
| Globe #3 | 14 | 20 | 8 | 42 | D+6 | 51.2% |
| Globe #4 | 89 | 100 | 52 | 241 | D+11 | 54.0% |
| Claypool #3 | 47 | 73 | 23 | 143 | D+26 | 46.9% |
| Globe #8 | 64 | 90 | 53 | 207 | D+26 | 52.1% |
| Miami #1 | 47 | 99 | 25 | 171 | D+52 | 51.2% |
| Copper Basin | 52 | 148 | 27 | 227 | D+96 | 56.9% |
| Gila County total | 8,699 | 3,366 | 3,079 | 15,144 | R+5,333 |
Pinal County (33)
| Precinct | 🔴 GOP | 🔵 DEM | 🟡 Other | Total | Lead | % of early ballots returned |
|---|---|---|---|---|---|---|
| Florence Anthem | 1,485 | 745 | 830 | 3,060 | R+740 | 66.1% |
| Superstition Mountain | 807 | 314 | 364 | 1,485 | R+493 | 72.8% |
| Gold Canyon | 836 | 444 | 507 | 1,787 | R+392 | 66.9% |
| Apache Junction N. Central | 633 | 279 | 319 | 1,231 | R+354 | 62.0% |
| Apache Junction South | 689 | 383 | 359 | 1,431 | R+306 | 53.1% |
| Copper Basin | 461 | 234 | 263 | 958 | R+227 | 40.2% |
| Apache Jct East | 510 | 288 | 290 | 1,088 | R+222 | 67.8% |
| Mountainbrook Village | 469 | 252 | 252 | 973 | R+217 | 80.1% |
| Aj Saddle Butte | 413 | 197 | 204 | 814 | R+216 | 49.7% |
| Peralta | 391 | 209 | 215 | 815 | R+182 | 61.6% |
| Florence North | 322 | 155 | 169 | 646 | R+167 | 72.1% |
| Gold Canyon North | 320 | 156 | 188 | 664 | R+164 | 71.9% |
| Apache Junction E. Central | 347 | 197 | 148 | 692 | R+150 | 50.8% |
| Aj Radiance | 349 | 218 | 226 | 793 | R+131 | 36.6% |
| Apache Jct Ne | 188 | 64 | 67 | 319 | R+124 | 59.1% |
| Apache Jct Superstition | 499 | 382 | 295 | 1,176 | R+117 | 58.0% |
| Flo Wild Horse | 204 | 87 | 93 | 384 | R+117 | 46.2% |
| Poston Butte | 341 | 249 | 227 | 817 | R+92 | 38.5% |
| Gold Canyon Renaissance | 236 | 155 | 141 | 532 | R+81 | 81.7% |
| Apache Jct Se | 363 | 299 | 252 | 914 | R+64 | 46.0% |
| Anthem West | 111 | 66 | 63 | 240 | R+45 | 41.6% |
| Queen Valley | 99 | 55 | 64 | 218 | R+44 | 57.4% |
| Apache Trail | 200 | 162 | 144 | 506 | R+38 | 47.8% |
| Sutton Summit | 26 | 12 | 10 | 48 | R+14 | 45.7% |
| Flo Kelvin | 17 | 5 | 9 | 31 | R+12 | 53.4% |
| Superior West | 7 | 0 | 2 | 9 | R+7 | 42.9% |
| Apache Jct Central | 274 | 293 | 158 | 725 | D+19 | 49.1% |
| San Manuel | 239 | 289 | 150 | 678 | D+50 | 49.8% |
| Dudleyville | 62 | 129 | 33 | 224 | D+67 | 55.2% |
| Kearny | 124 | 204 | 52 | 380 | D+80 | 46.6% |
| Oracle South | 333 | 453 | 223 | 1,009 | D+120 | 58.8% |
| Mammoth | 55 | 177 | 30 | 262 | D+122 | 47.5% |
| Superior | 110 | 306 | 90 | 506 | D+196 | 49.1% |
| Pinal County total | 11,520 | 7,458 | 6,437 | 25,415 | R+4,062 |
Coconino County (18)
| Precinct | 🔴 GOP | 🔵 DEM | 🟡 Other | Total | Lead | % of early ballots returned |
|---|---|---|---|---|---|---|
| Williams | 886 | 325 | 368 | 1,579 | R+561 | 55.9% |
| Blue Ridge | 264 | 72 | 91 | 427 | R+192 | 64.9% |
| Pinewood | 283 | 145 | 132 | 560 | R+138 | 60.2% |
| Parks South | 123 | 60 | 60 | 243 | R+63 | 57.0% |
| Forest Lakes | 48 | 17 | 22 | 87 | R+31 | 54.7% |
| Mormon Lake | 54 | 36 | 27 | 117 | R+18 | 55.2% |
| Walnut Canyon | 24 | 11 | 7 | 42 | R+13 | 58.3% |
| Ranches South | 59 | 56 | 50 | 165 | R+3 | 66.8% |
| Oak Creek | 23 | 29 | 22 | 74 | D+6 | 54.8% |
| Meteor | 5 | 13 | 3 | 21 | D+8 | 35.0% |
| Flagstaff 12 | 3 | 62 | 35 | 100 | D+59 | 31.2% |
| Flagstaff 14 | 129 | 338 | 164 | 631 | D+209 | 49.4% |
| Flagstaff 7 | 17 | 262 | 114 | 393 | D+245 | 32.4% |
| Flagstaff 15 | 639 | 956 | 605 | 2,200 | D+317 | 63.0% |
| Pumphouse Wash | 357 | 729 | 409 | 1,495 | D+372 | 60.5% |
| Flagstaff 5 | 242 | 617 | 374 | 1,233 | D+375 | 55.4% |
| Flagstaff 9 | 287 | 680 | 387 | 1,354 | D+393 | 56.0% |
| Flagstaff 13 | 533 | 1,229 | 718 | 2,480 | D+696 | 58.7% |
| Coconino County total | 3,976 | 5,637 | 3,588 | 13,201 | D+1,661 |
Navajo County (10)
| Precinct | 🔴 GOP | 🔵 DEM | 🟡 Other | Total | Lead | % of early ballots returned |
|---|---|---|---|---|---|---|
| Bison | 2,795 | 895 | 933 | 4,623 | R+1,900 | 53.4% |
| Pioneer | 2,237 | 344 | 546 | 3,127 | R+1,893 | 44.8% |
| Woodland | 1,656 | 767 | 647 | 3,070 | R+889 | 56.6% |
| Mogollon | 830 | 217 | 251 | 1,298 | R+613 | 55.6% |
| Juniper | 590 | 156 | 210 | 956 | R+434 | 48.1% |
| Sitgreaves | 293 | 131 | 121 | 545 | R+162 | 48.2% |
| Antelope | 66 | 19 | 21 | 106 | R+47 | 45.1% |
| Elk | 31 | 9 | 10 | 50 | R+22 | 61.7% |
| Maverik | 3 | 1 | 3 | 7 | R+2 | 41.2% |
| Wild Horse | 1 | 0 | 0 | 1 | R+1 | 33.3% |
| Navajo County total | 8,502 | 2,539 | 2,742 | 13,783 | R+5,963 |
These are ballots returned, not votes.
Latest county file dates: Navajo County 10/30. All other counties 11/2.
Precincts in LD 7: Coconino County GIS precinct layer overlaid on Coconino County GIS legislative district layer (matches the AZ Independent Redistricting Commission 2022 map).
Coconino County precincts follow the county's official district map, which places some precincts in a different district than the grouping in the county early ballot files. A day-by-day chart is not shown for LD 7 because the daily files use that other grouping.
Note: Coconino County precinct shapes come from the county's official precinct map. That map differs from the precinct grouping in the county early ballot files for 11 Coconino precincts (10 of them in LD 7). Coconino County's totals still match.
Data: compiled from Arizona county recorders' early ballot return files, by party registration. Poll hours and drop-off rules: Arizona Secretary of State. This is not an official state or county release.