
LD 9 live results
Updated 7:19 a.m. ET, Wed., Nov. 4, 2026
Unofficial results as posted by the Arizona Secretary of State. Numbers change as counties count more ballots. Margin = Republican minus Democratic votes.
State Senate, LD 9
🔴 Bridget Fitzgibbons (Rep.): 19,444 (39.5%)
🔵 Kiana Maria Sears (Dem.): 29,740 (60.4%)
🟡 Write-in candidates (Write-in): 44 (0.1%)
Votes posted: 49,228
Reporting units posted: 1 of 1
Margin: Kiana Maria Sears (Dem.) has 10,296 more votes than Bridget Fitzgibbons (Rep.) (20.9 pts), of 49,228 votes counted
State House, LD 9
🔴 Bradley D. Bettencourt (Rep.): 19,410 (26.0%)
🔵 Lorena Austin (Dem.): 27,566 (36.9%)
🔵 Jacob D. Martinez (Dem.): 27,495 (36.8%)
🟡 Write-in candidates (Write-in): 321 (0.4%)
Votes posted: 74,792
Reporting units posted: 1 of 1
Voters choose 2 House members. Percent = share of all House votes cast in the district.
Source: Arizona Secretary of State. Unofficial results.
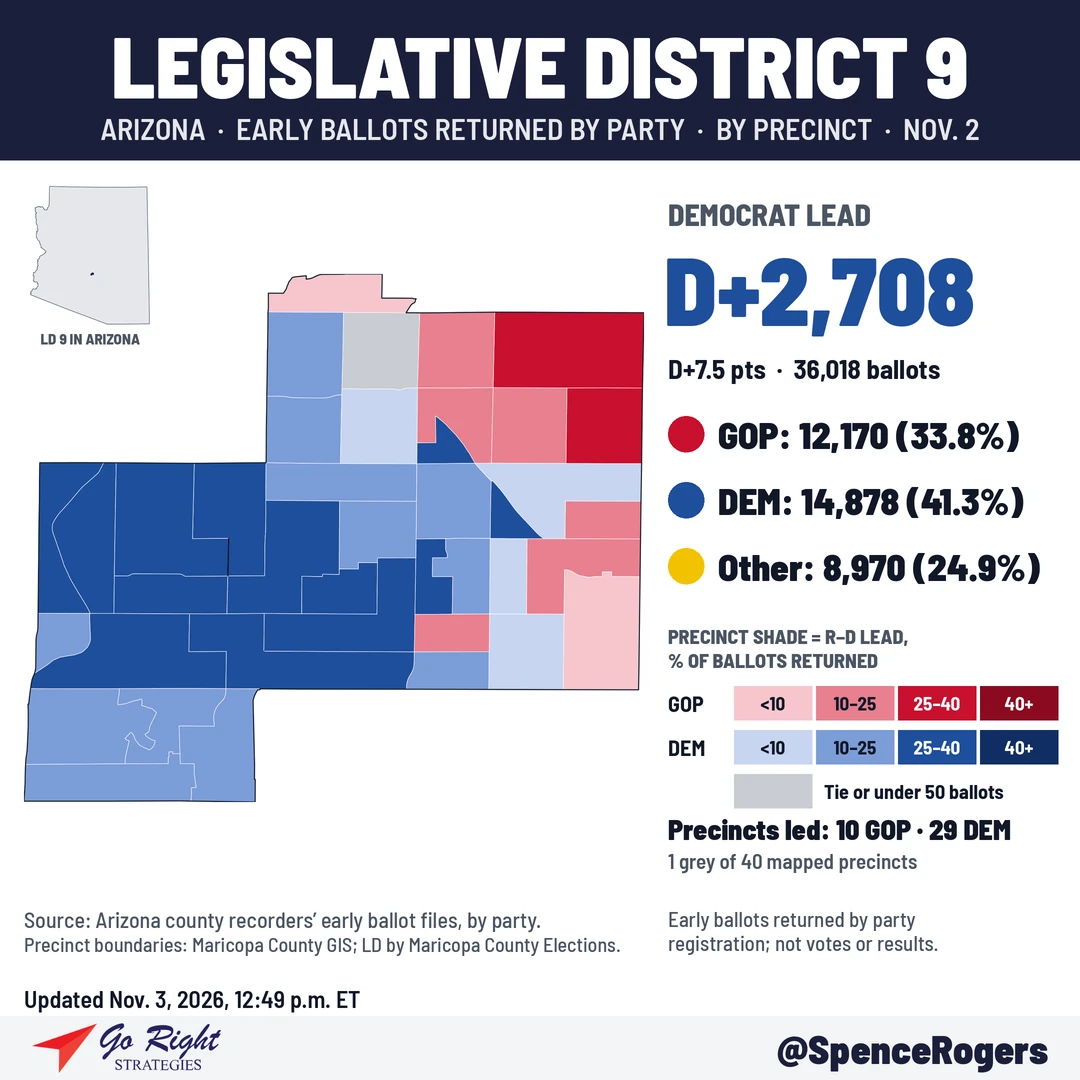
Updated Nov. 3, 2026, 12:49 p.m. ET
🔴 Republicans: 12,170 (33.8%)
🔵 Democrats: 14,878 (41.3%)
🟡 Other: 8,970 (24.9%)
Total returned: 36,018
Margin: D+2,708
Percentages are rounded and may not add to 100%.
Election Day analysis
Updated Nov. 3, 2026, 2:06 p.m. ET
No Election Day turnout by party is posted yet. Arizona counties do not post in-person Election Day turnout by party during the day. Polls close at 7 p.m. Arizona time (9 p.m. ET). Voters can still drop off early ballots at any voting location in their county until 7 p.m. Arizona time.
Election Day turnout so far (county counts)
Maricopa County: about 59,100 voters served at Vote Centers as of 12:00 p.m. ET (10 a.m. Arizona time). Countywide, not LD only.
May include early ballots dropped off at Vote Centers.
Source: Arizona county recorders. Figure posted by Maricopa County Elections. These are turnout counts, not votes, with no party breakdown. Counts are early in the day and will rise.
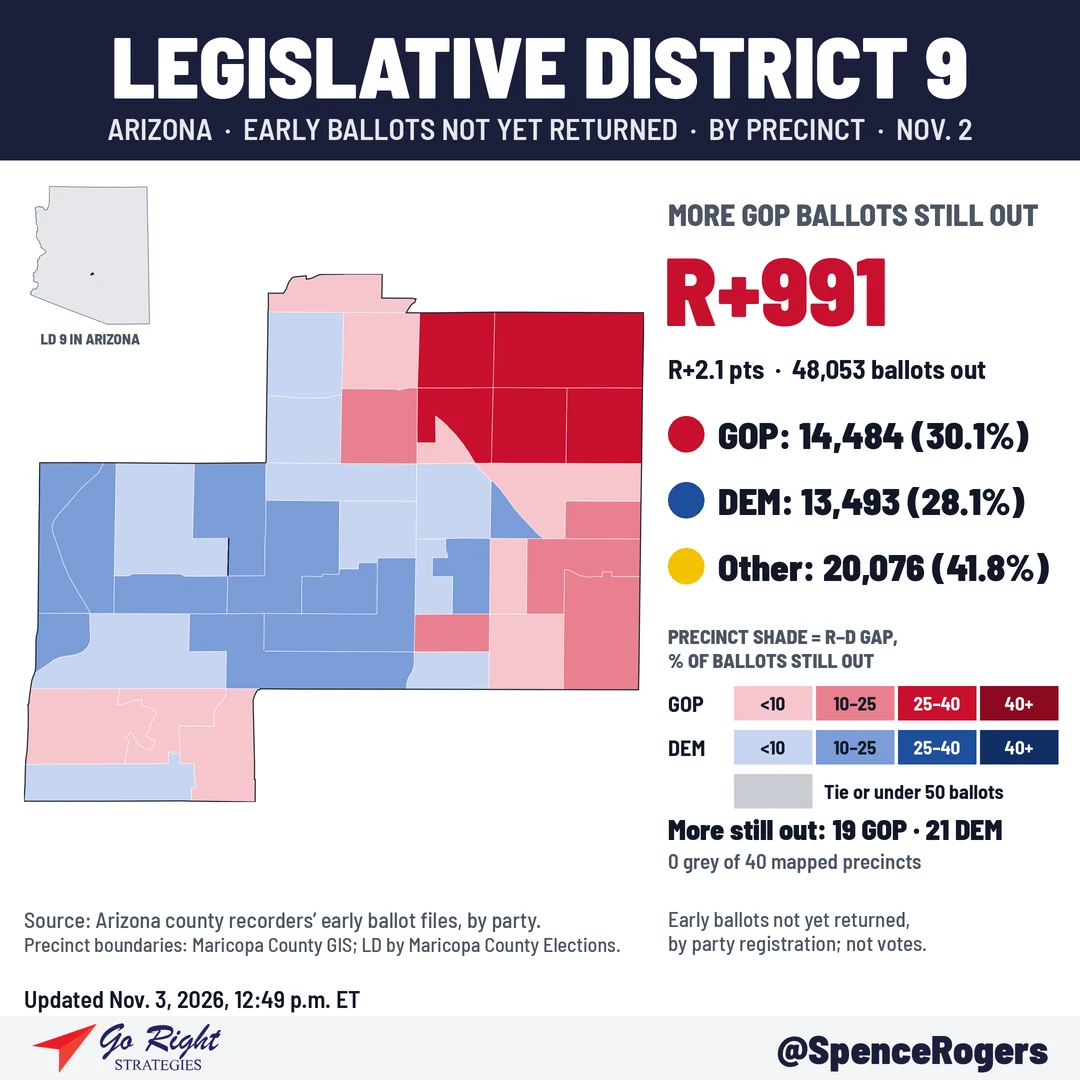
Precinct boundaries: Maricopa County GIS.
Early ballots sent but not yet returned in LD 9
🔴 Republicans: 14,484 (30.1%)
🔵 Democrats: 13,493 (28.1%)
🟡 Other: 20,076 (41.8%)
Total not yet returned: 48,053
Margin: R+991
Returned so far: 45.7% of Republican early ballots, 52.4% of Democratic early ballots, 30.9% of Other early ballots.
Not yet returned = early ballots sent minus early ballots returned, by party registration, from the same county files. Some of these voters will drop off their ballot today, some will vote in person, and some will not vote. These are not votes.
LD 9 precincts (40)
| Precinct | 🔴 GOP | 🔵 DEM | 🟡 Other | Total | Lead | % of early ballots returned |
|---|---|---|---|---|---|---|
| Arboleda | 864 | 362 | 337 | 1,563 | R+502 | 49.6% |
| Los Alamos | 597 | 268 | 239 | 1,104 | R+329 | 47.8% |
| Candlelight | 662 | 340 | 290 | 1,292 | R+322 | 52.2% |
| Covina | 542 | 348 | 231 | 1,121 | R+194 | 45.5% |
| Sun Trails | 513 | 337 | 246 | 1,096 | R+176 | 43.8% |
| Harmony Park | 633 | 530 | 371 | 1,534 | R+103 | 44.5% |
| Orange | 374 | 273 | 203 | 850 | R+101 | 63.3% |
| Tierra Este | 347 | 249 | 183 | 779 | R+98 | 47.4% |
| Mesa Grand | 204 | 129 | 91 | 424 | R+75 | 38.3% |
| Palm Harbor | 202 | 177 | 96 | 475 | R+25 | 36.2% |
| Mesa Vista | 434 | 434 | 265 | 1,133 | Tied | 43.2% |
| Briar | 208 | 223 | 141 | 572 | D+15 | 41.5% |
| Porter | 369 | 390 | 219 | 978 | D+21 | 38.0% |
| Palm Gardens | 30 | 62 | 34 | 126 | D+32 | 36.0% |
| Harris | 79 | 137 | 78 | 294 | D+58 | 36.6% |
| Old West | 321 | 381 | 268 | 970 | D+60 | 39.2% |
| Centennial | 188 | 252 | 113 | 553 | D+64 | 36.6% |
| Oak Park | 32 | 97 | 43 | 172 | D+65 | 27.6% |
| Reed Park | 145 | 212 | 109 | 466 | D+67 | 37.6% |
| Pilgrim | 455 | 532 | 368 | 1,355 | D+77 | 44.4% |
| Ellsworth Park | 172 | 250 | 155 | 577 | D+78 | 32.1% |
| Penny Lane | 64 | 164 | 116 | 344 | D+100 | 33.2% |
| Longmore | 71 | 177 | 96 | 344 | D+106 | 38.5% |
| Mcafee Place | 100 | 208 | 104 | 412 | D+108 | 38.0% |
| Mesa Linda | 183 | 304 | 177 | 664 | D+121 | 34.5% |
| Carriage Lane | 359 | 506 | 288 | 1,153 | D+147 | 49.1% |
| Kleinman | 140 | 312 | 185 | 637 | D+172 | 32.7% |
| Duke | 263 | 436 | 214 | 913 | D+173 | 46.8% |
| Dover | 232 | 427 | 192 | 851 | D+195 | 69.2% |
| Hohokam Park | 268 | 466 | 277 | 1,011 | D+198 | 38.9% |
| Evergreen | 191 | 392 | 184 | 767 | D+201 | 46.6% |
| Crismon | 563 | 767 | 429 | 1,759 | D+204 | 47.3% |
| Water Works | 380 | 591 | 341 | 1,312 | D+211 | 49.7% |
| Dobson Ranch | 597 | 847 | 507 | 1,951 | D+250 | 52.2% |
| Indian Springs | 192 | 469 | 283 | 944 | D+277 | 33.3% |
| Heritage | 207 | 507 | 265 | 979 | D+300 | 35.8% |
| Guerrero | 157 | 459 | 224 | 840 | D+302 | 34.3% |
| Esquire | 218 | 523 | 283 | 1,024 | D+305 | 36.6% |
| Woodglen | 325 | 669 | 373 | 1,367 | D+344 | 46.0% |
| Buckley | 289 | 671 | 352 | 1,312 | D+382 | 39.0% |
| Precinct total | 12,170 | 14,878 | 8,970 | 36,018 | D+2,708 |
Totals on this page are precinct sums. They differ from Maricopa County's own LD 9 total by a few ballots.
These are ballots returned, not votes.
Precincts in LD 9: Maricopa County Elections GIS, Voter Totals by Voting Precinct (LegislativeDistrict field).
Data: compiled from Arizona county recorders' early ballot return files, by party registration. Poll hours and drop-off rules: Arizona Secretary of State. This is not an official state or county release.